Zoisite-Ruby section. Ruby fluorescence. Raman spectra.
 |
|
|
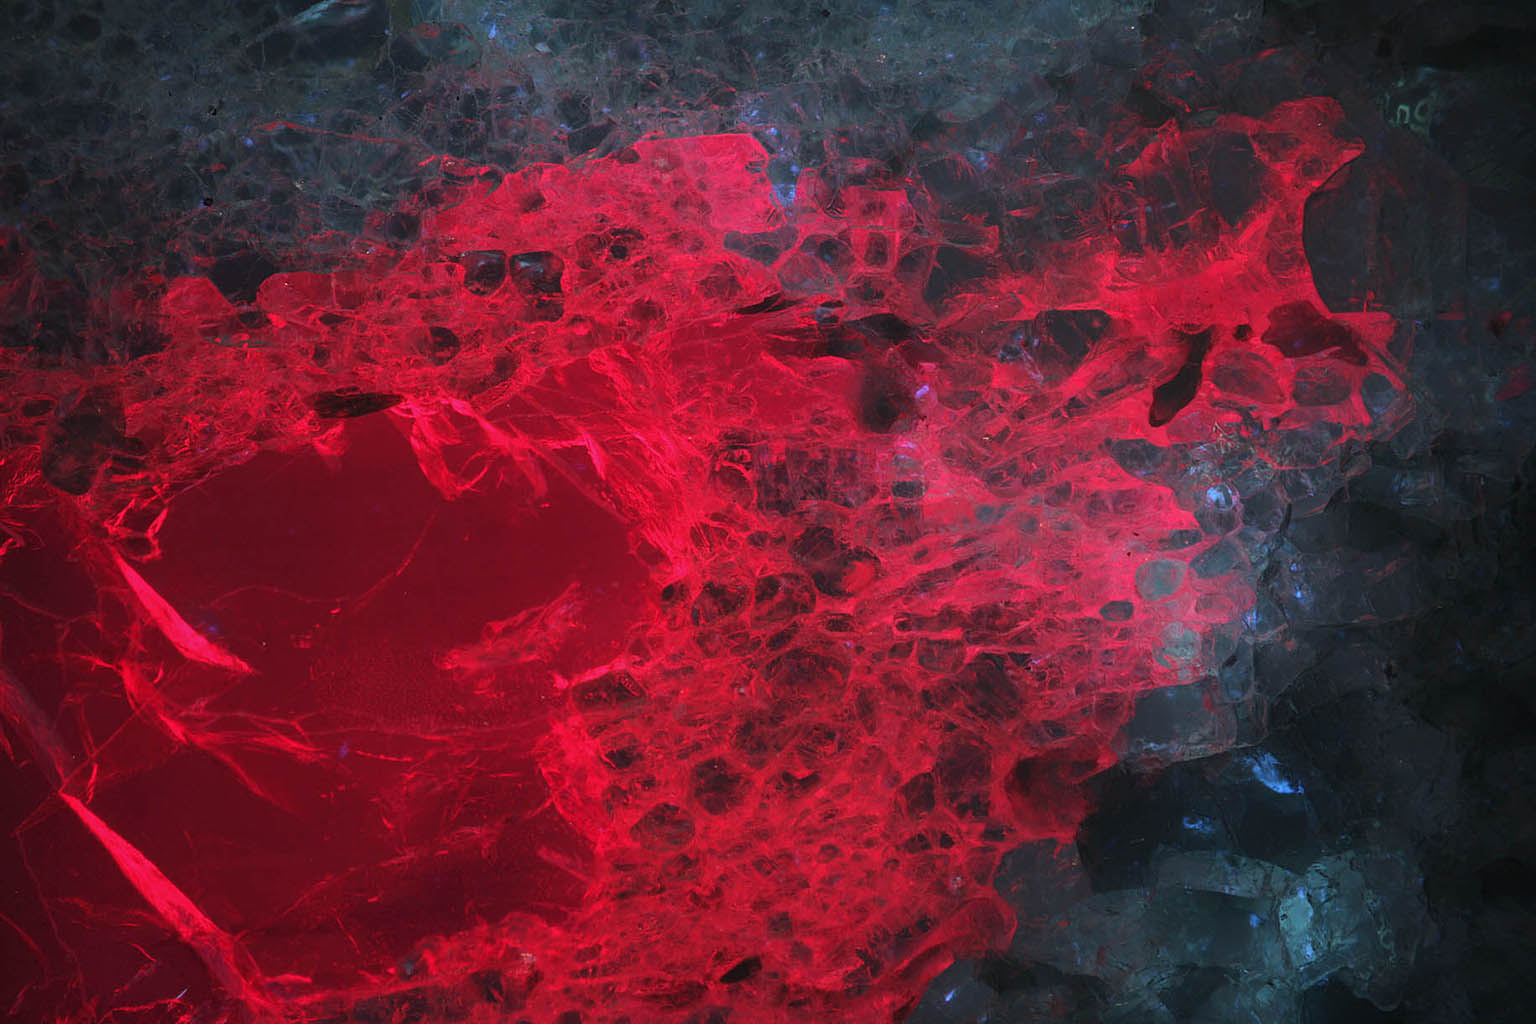
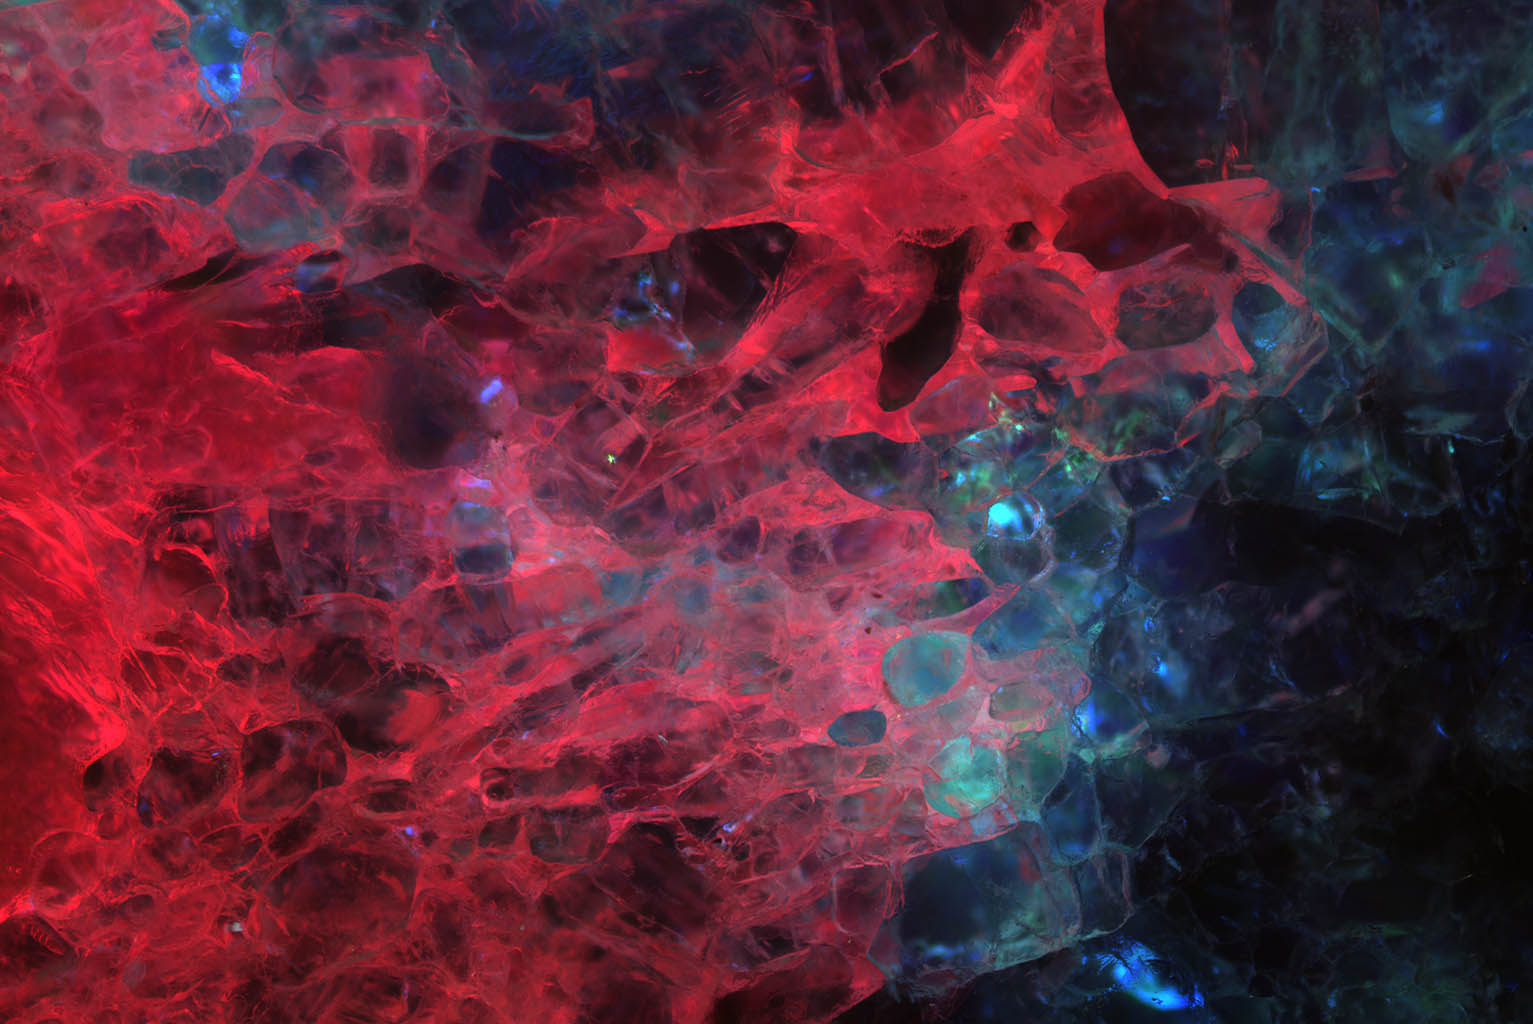
Figure 1. Ruby fluorescence recorded with a reflex camera. Transmission illumination by a 405 nm violet laser.
|
|
 |
|
|
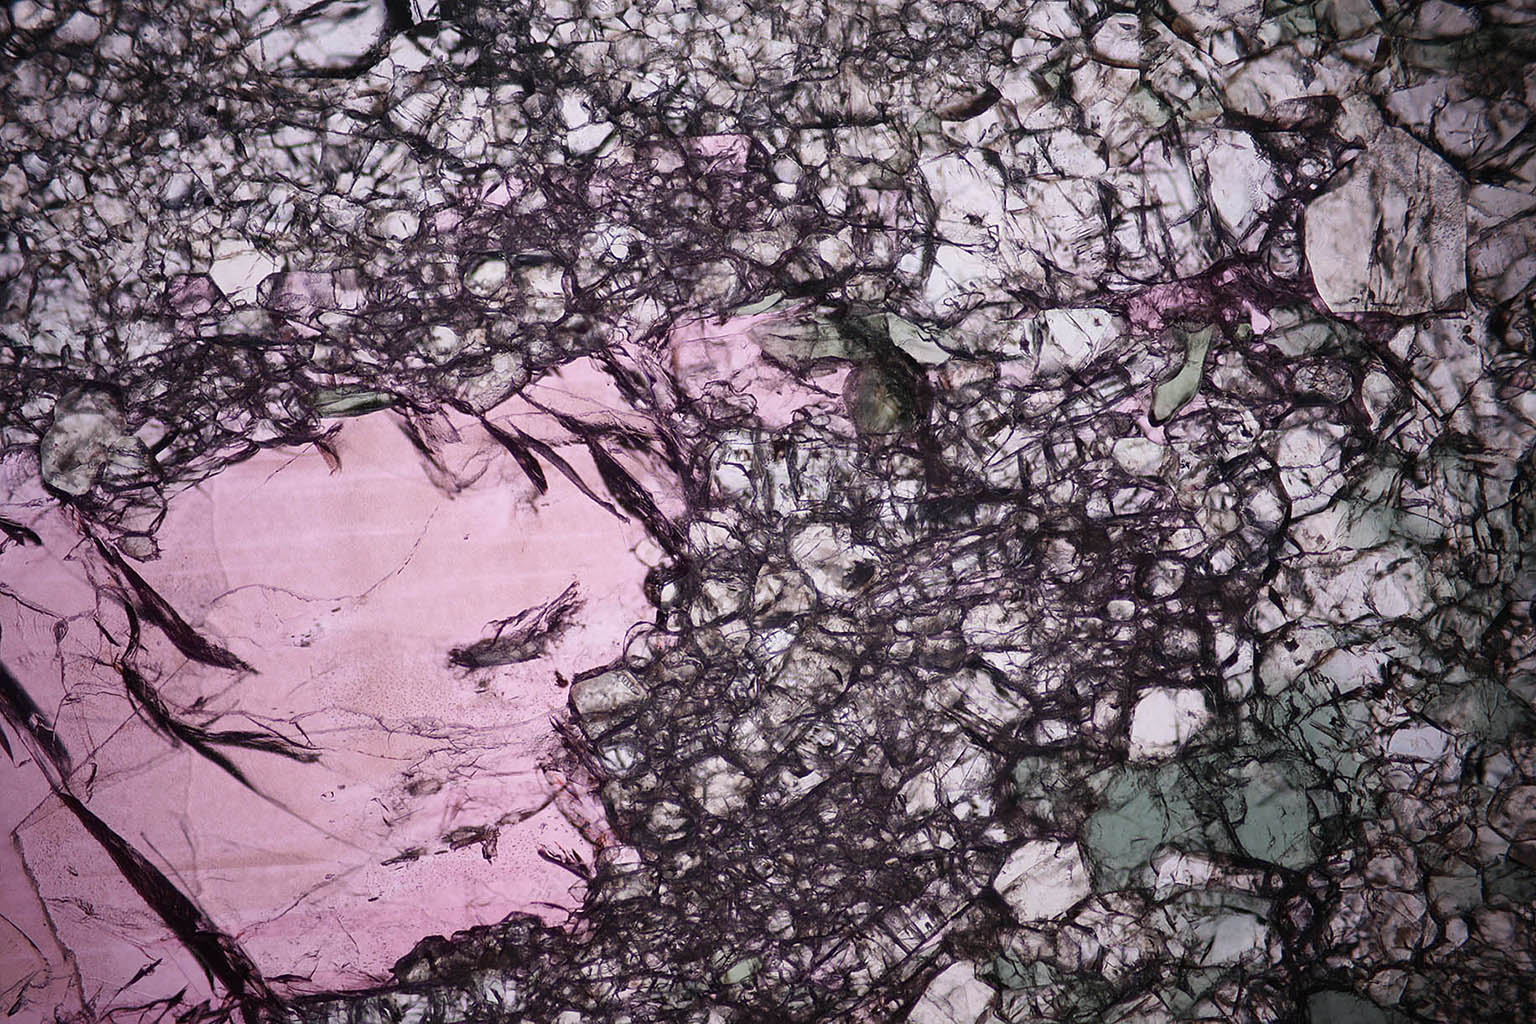
Figure 2. Same section as figure 1, white light plane polarized illumination. Pink ruby, green pargasite and clear zoisite.
|
|
 |
|
|
Figure 3. Same section recorded in LRGB with a ZWO ASI 183 astronomical camera. It is a black and white camera so a picture must be taken in the three colors red, green and blue with appropriate filters and be mounted together to produce a color image.
|
|
|
|
|
|
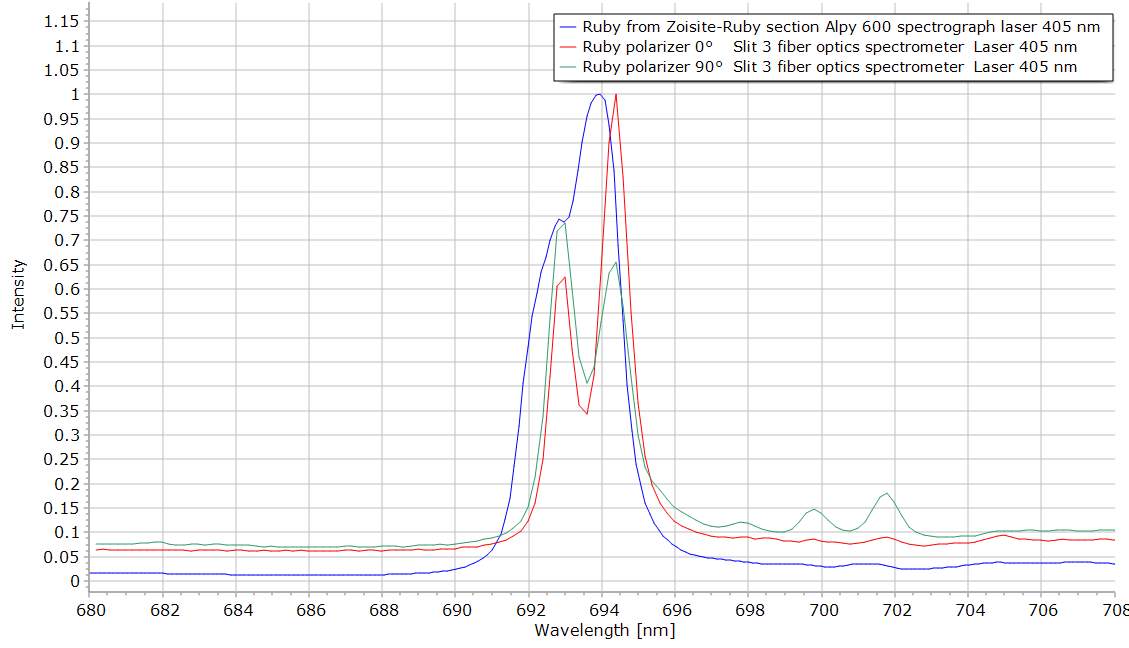
Figure 4. Comparison of the Alpy 600 spectrograph with the fiber optics spectrometer for fluorescent work. The Alpy 600 has less resolution but can be used in lower light conditions because it is a spectrograph coupled to a CMos camera which can accumulate the signal to increase the SNR. In contrast, the fiber spectrometer is a scanning system with a photodiode detector without accumulation. The crystal section measured in this figure has much less anisotropy than the crystal examined in the figure below.
|
|
|
|
|
|
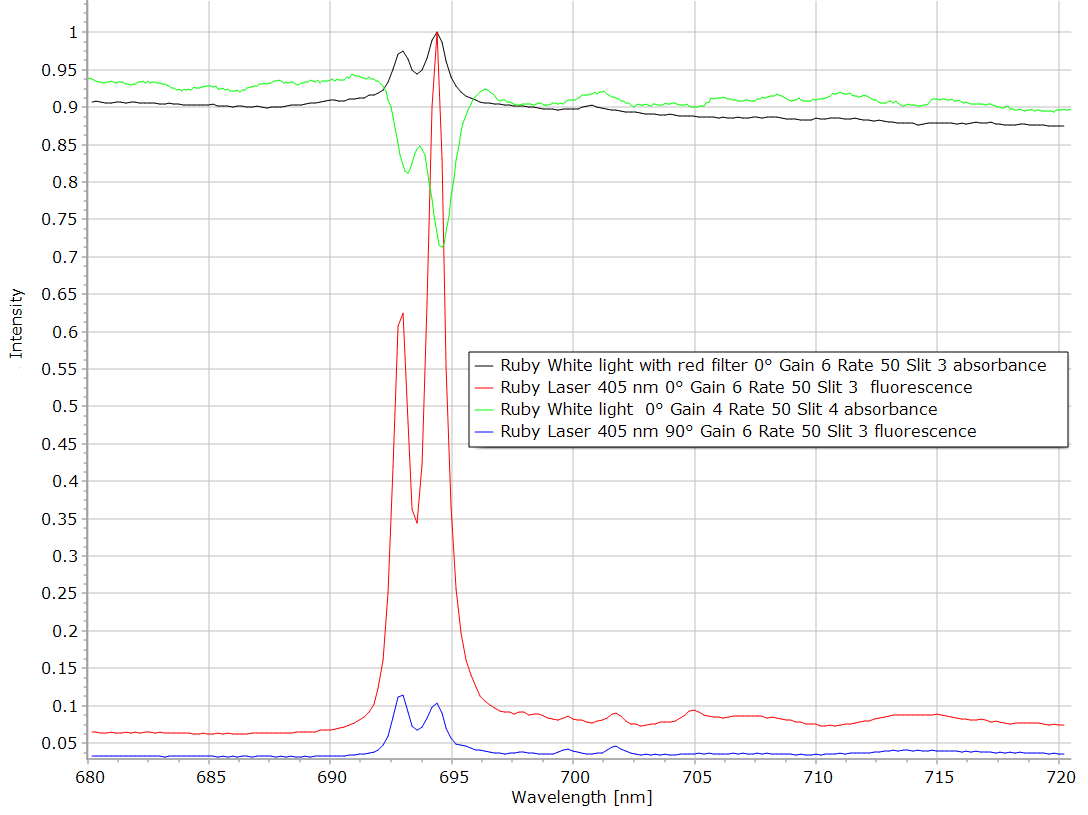
Figure 5: Absorbance-fluorescence spectra. Ruby. Detail of the band close to 700 nm at higher resolution. The green curve in figure 11 is the fluorescence recorded with white light as the source. The peak is negative because fluorescence in an emission and not an absorption. If a red filter is placed between the source and the spectrometer, no fluorescence is emitted and the spectrum is a real absorption (black curve). The red and blue curves are fluorescence emission excited by a violet laser at 405 nm. It is seen that the polarized fluorescence varies according to the orientation of the crystal.
|
|
|
|
|
|
|
|
|
Figure 6: Ruby absorption spectra. Ruby absorption spectra, detector 1 visible, grating 1600 grooves / mm limited to 900 nm. Spectra recorded for two orientations of the section showing the pleochroism of ruby. The negative peak at 15500 cm-1 is in fact fluorescence because the sample is always illuminated by the whole wavelength range of the source in this kind of spectrometer. The fluorescence at 15500 cm-1 is produced by the blue light of the source. As fluorescence is an emission, it appears thus negative in an absorbance spectrum. Ruby has already been examined with a previous version of the spectrometer. |
|
|
|
Raman spectra of the Zoisite-Ruby section |
|
|
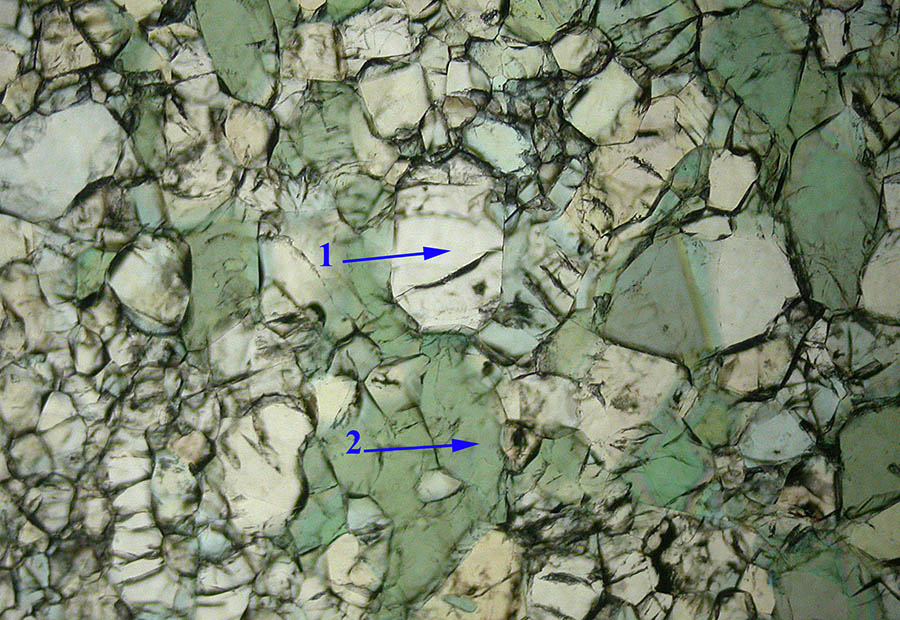
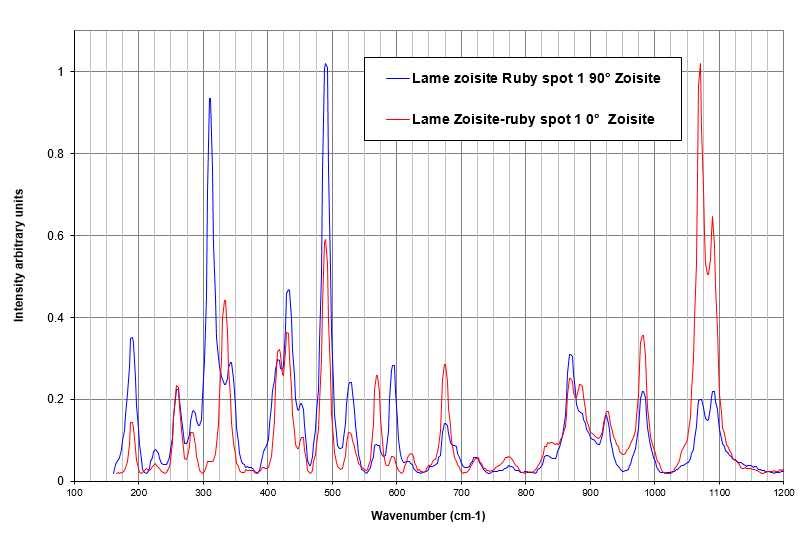
The clear crystals in the section are the Zoisite like spot 1. |
|
|
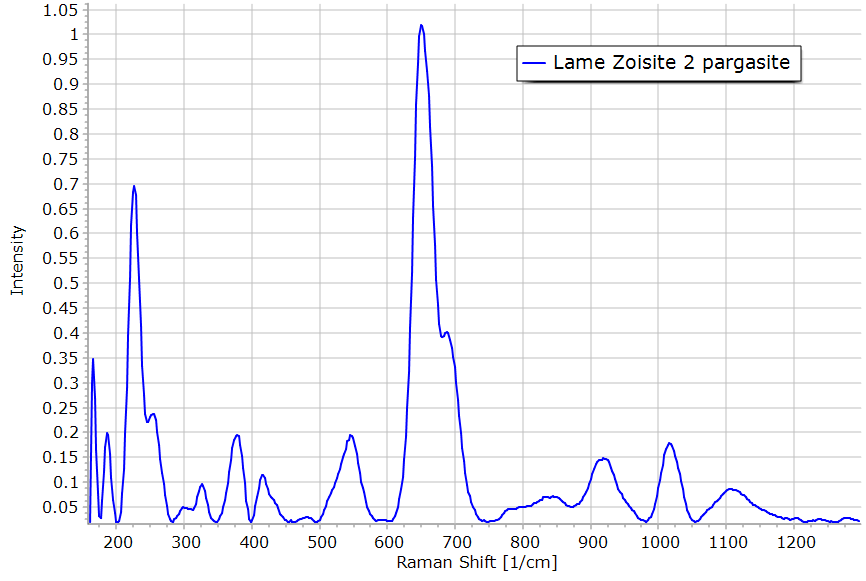
The green crystal labeled 2 is pargasite a hornblende family material. |
|
|
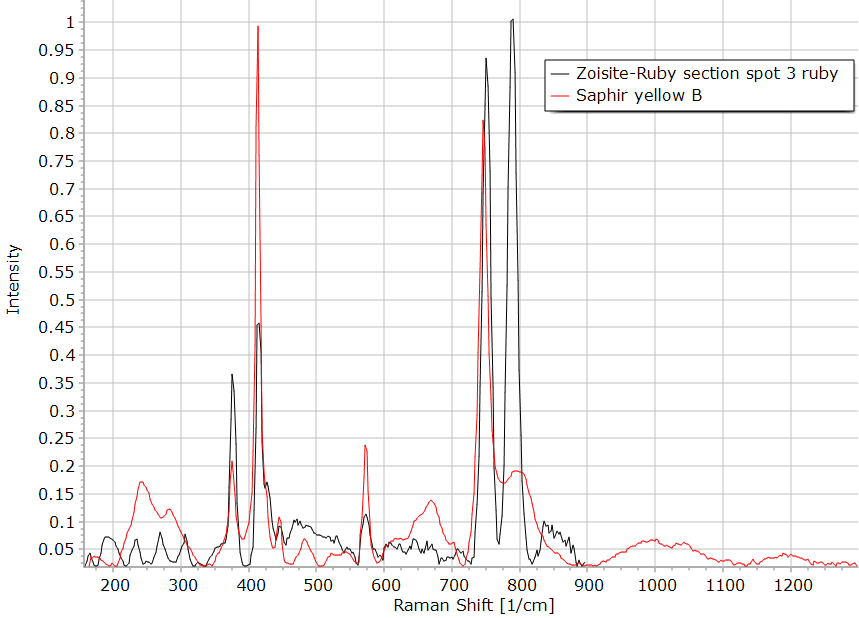
The red fluorescent material is the ruby. The spectrum is given on the left. The Raman profile is rather obscured by fluorescence bands. The Raman spectrum of a yellow saphir crystal has been recorded for comparison. |
|
|
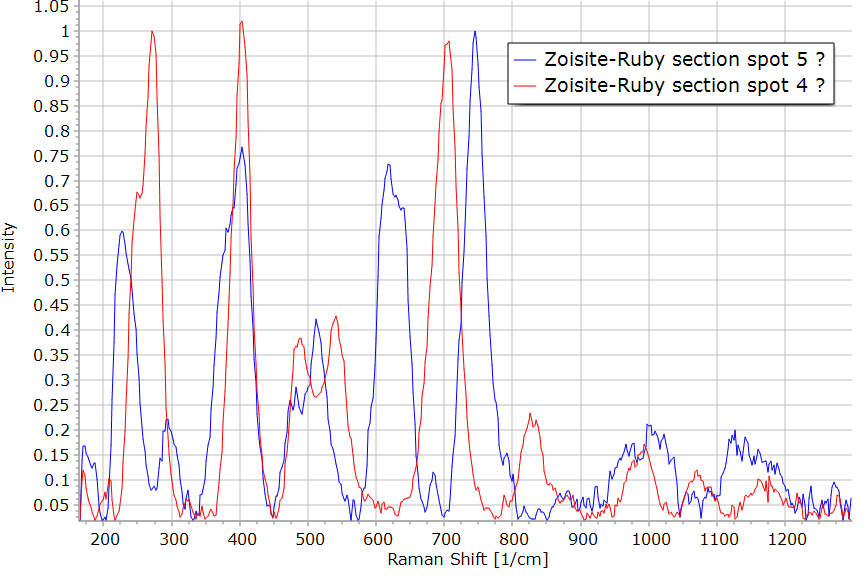
In this section, a brown area illustrated below has also been investigated. The two spectra of spots 4 and 4 are shown on the left. The identification is not yet successful. The small particle number 5 could be titanite but this is not completely demonstrated. |
 |
|
