Alpy 600 astronomical Spectrograph on a Microscope
|
|
Figure 1: Alpy 600 mounted on a microscope for fluorescence spectra measurement. The small Alpy 600 is connected to an Olympus CMAD3 accessory with a C-mount - T-mount adapter. The black and white camera used to record the spectra is a cooled astronomical ZWO ASI183. Spectra can be easily accumulated and averaged. Two sources for fluorescence work are used: a 360 nm UV LED and a 405 nm laser. They are described in the fluorescence page. The UV Light is sent to the microscope stage with a 45° adjustable mirror. An aspheric lens has been added on top of the microscope condensor to increase the amount of light at the center of the field and thus the signal to noise ratio of the spectra. Filters can be introduced in the light pass through the accessory slot of the microscope. |
|
|
|
|
Figure 2 : color spectrum of a mercury lamp and neon lamp added together.
|
|
|
|
|
|
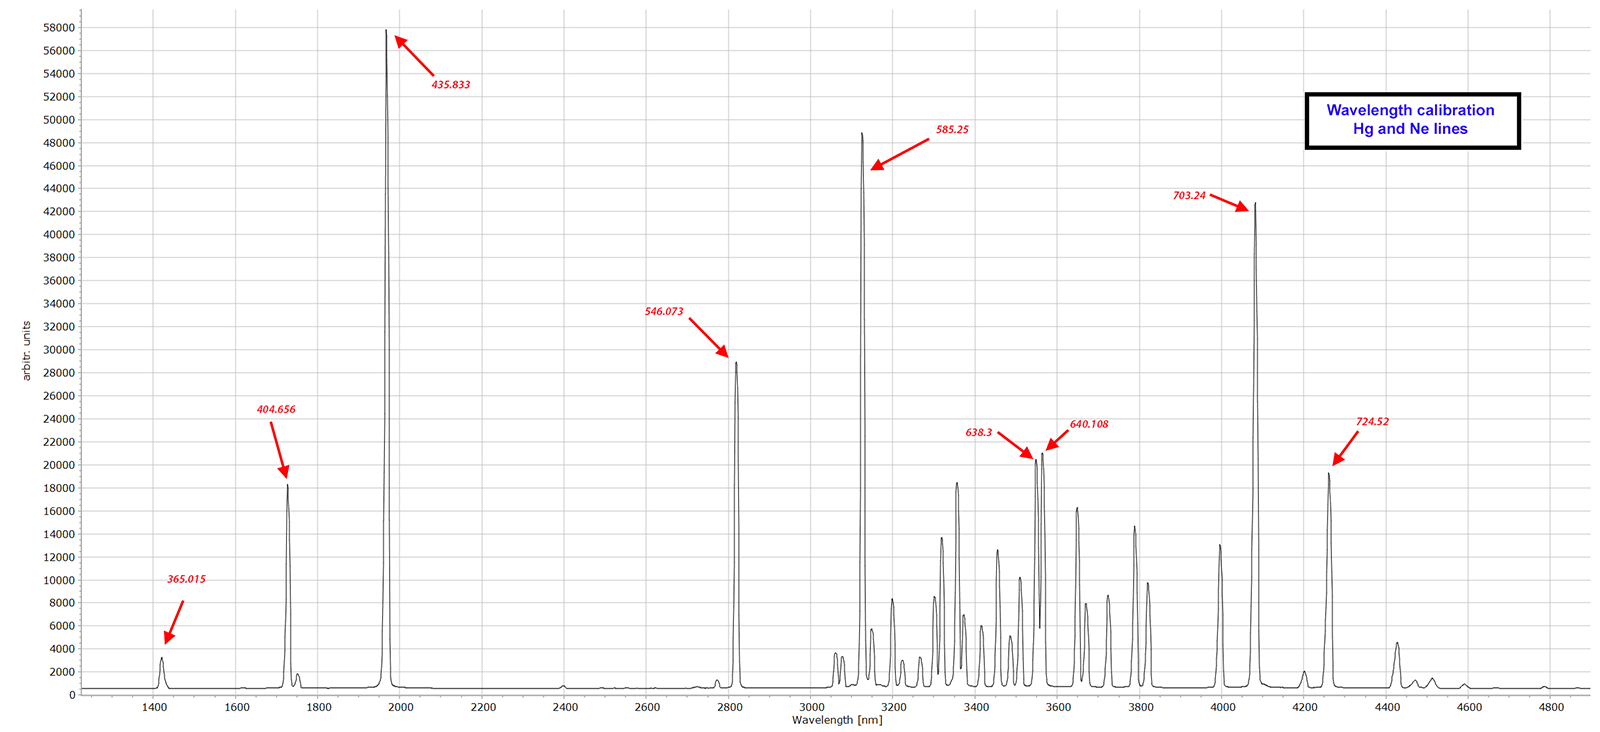
Figure 3: addition of mercury lamp and neon lamp spectra. This spectrum is used to calibrate the wavelengths of the spectrograph. The abscissa of this diagram is the pixel number. The lines which are used for calibration are marked in red.
|
|
|
|
|
|
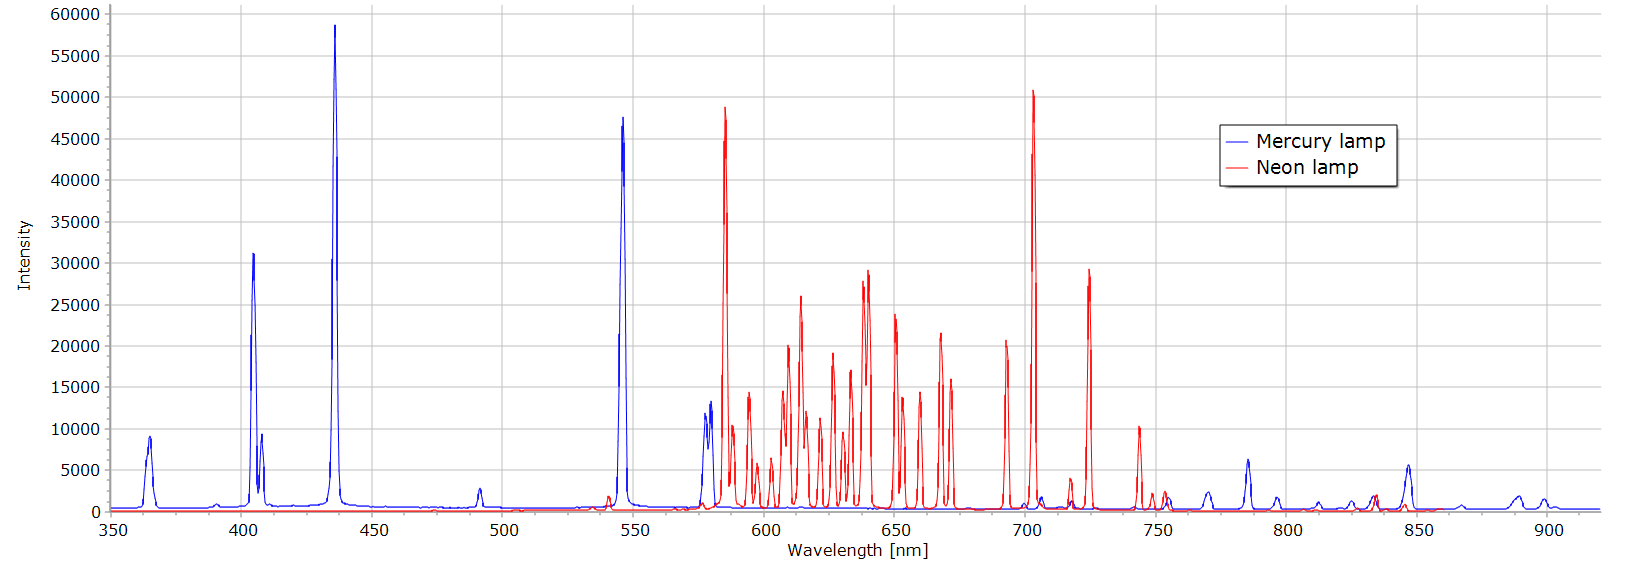
Figure 4: calibrated spectra of neon and mercury. The 2 sources cover the entire wavelength range of the spectrograph. The blue lines on the right of the spectrum are not mercury but probably argon used in the tube. This is the best resolution which can be obtained with the Alpy 600 with the narrower slit.
|
|
|
|
|
|
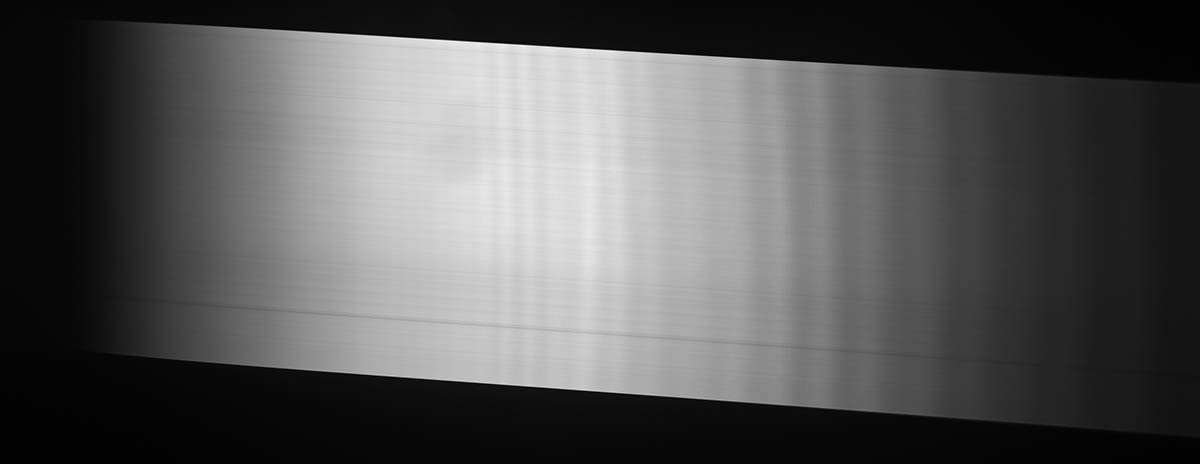
Figure 4: image of an halogen lamp spectrum through the microscope. Darker waves appear in the spectrum as artifacts. This problem caused by the spectrograph or the camera sensor must be corrected for to get a clean spectrum.
|
|
|
|
|
|
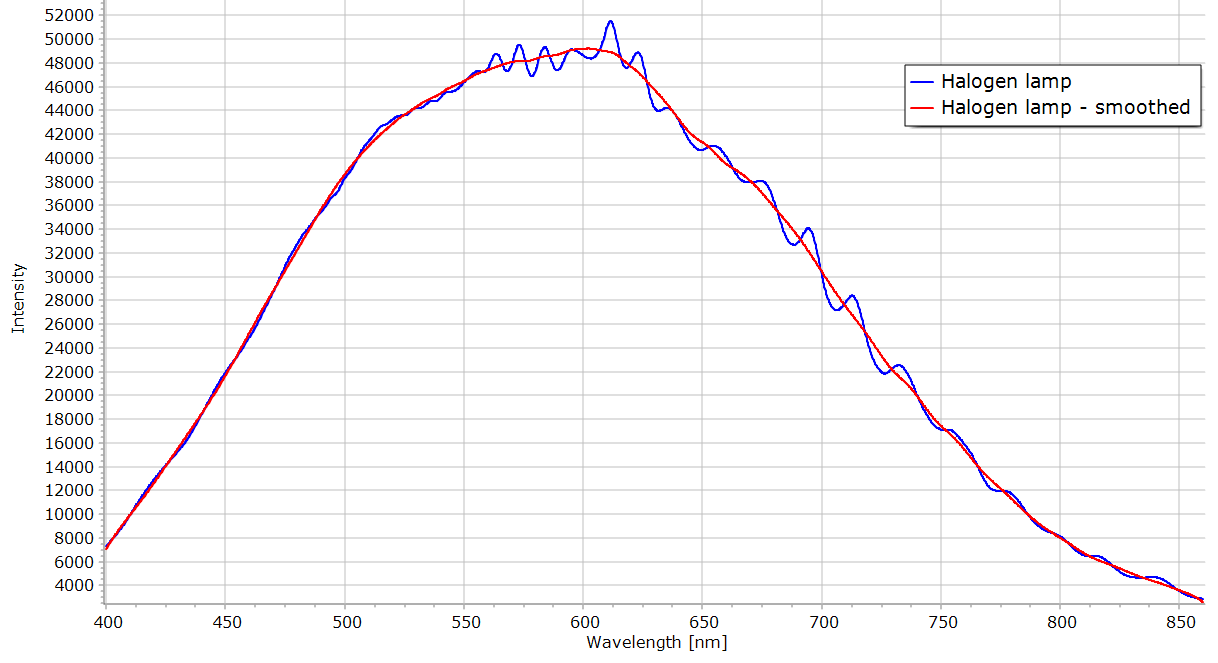
Figure 5: White light spectrum. The blue curve is the spectrum of figure 4. The artifacts oscillations are clearly visible. To cancel them, a smoothed spectrum could be created (red curve in the figure) from the original blue curve. The division of the red smoothed spectrum by the original blue one provide a correction function for the spectra as can be seen in the figure 6 below.
|
|
|
|
|
|
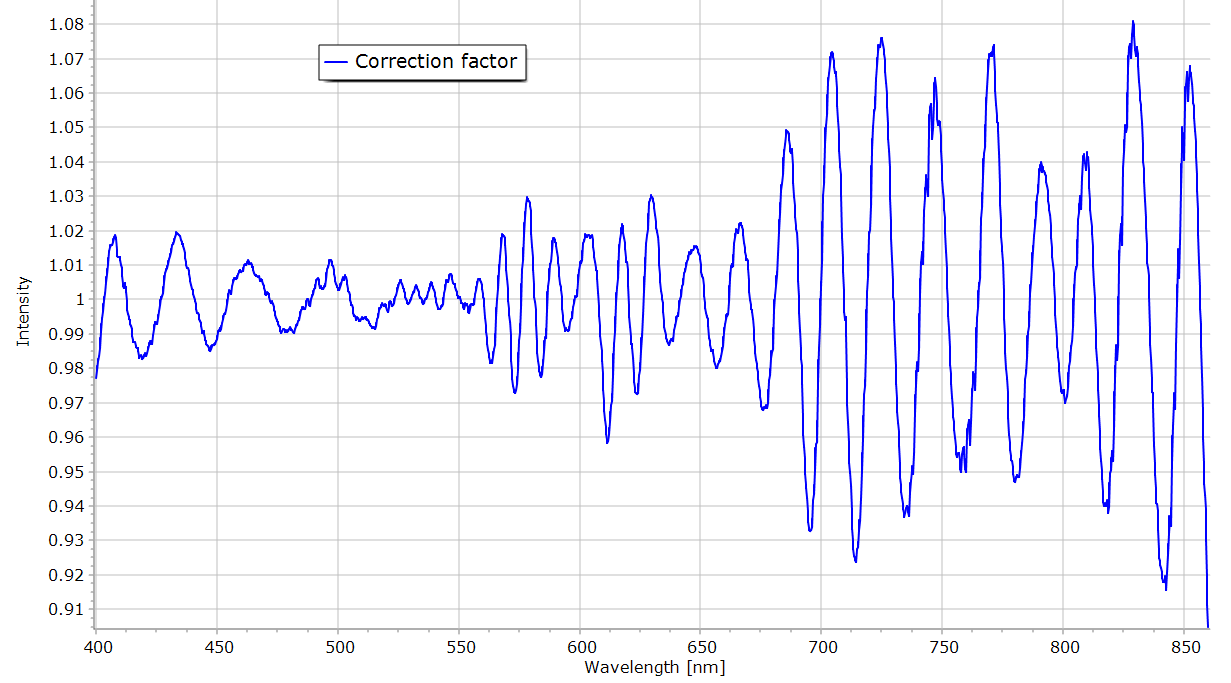
Figure 6: correction function for the non uniform response of the spectrograph and detector. The raw spectrum should be multiplied by this factor to be corrected for the oscillatory response of the system.
|
|
|
|
|
|
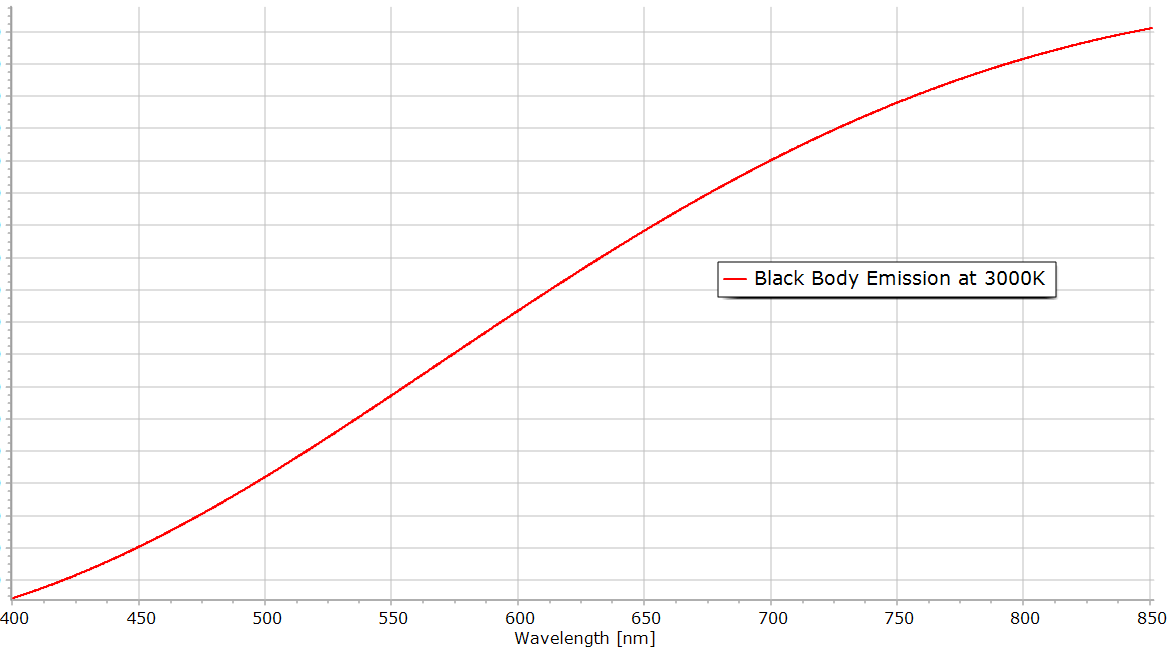
Figure 7 : black body emission. The smoothed spectrum of figure 5 is far from the energy spectrum of an halogen bulb which could be approximated by a black body radiator. The curve above has been calculated with the Plank law for a temperature of 3000K. This curve could be used to correct the spectra to get a more realistic spectrum.
|
|
|
|
|
|
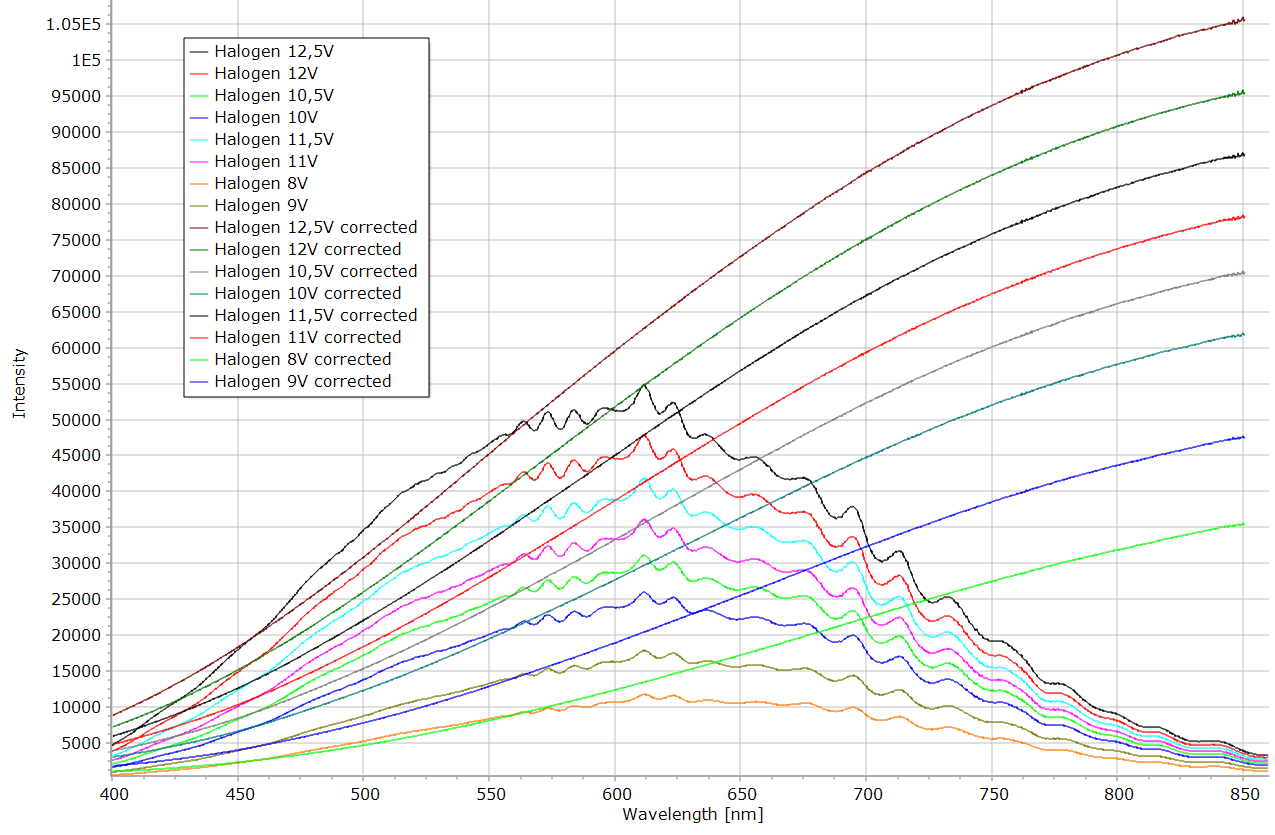
Figure 8: halogen spectra as a function of lamp voltage. The applications of the corrections of figure 6 and 7 to the raw halogen lamp spectra for different lamp voltages give the corrected spectra in the figure.
|
|
|
|
|
|
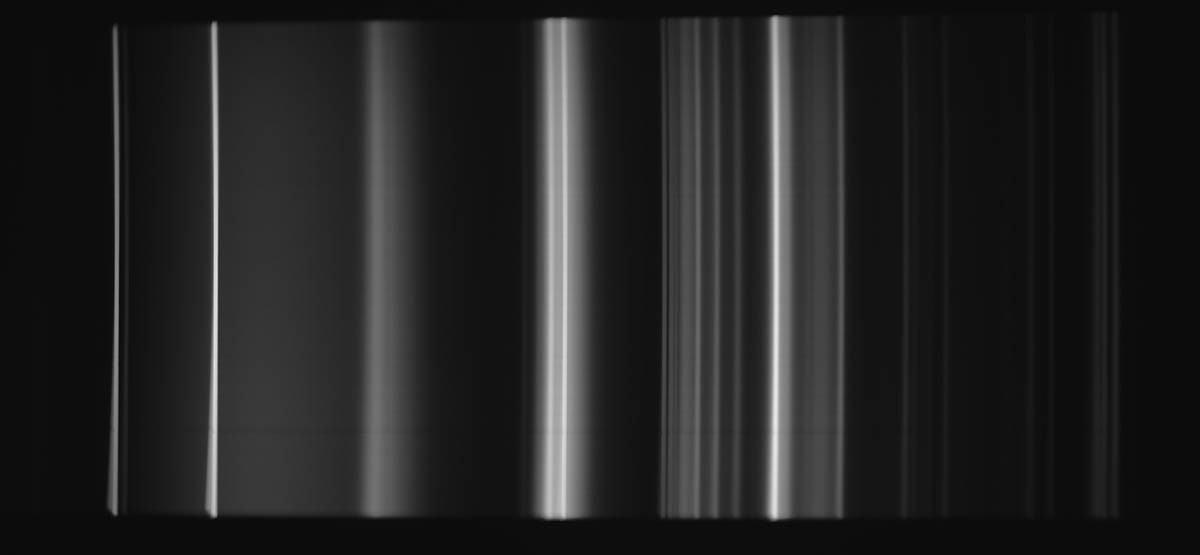
Figure 9: fluorescent tube image spectrum.
|
|
|
|
|
|
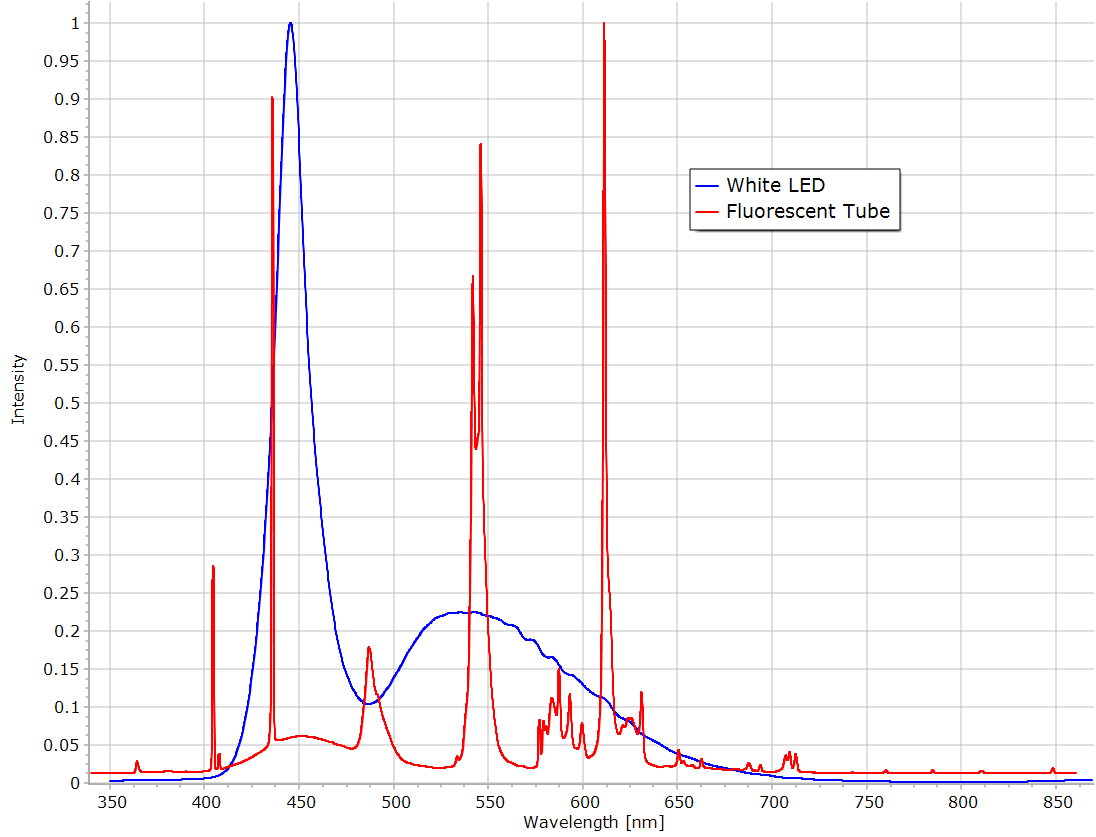
Figure 10. Spectrum of a fluorescent tube and a white LED.
|
|


