Fluorescence Spectroscopy
![]()
|
|
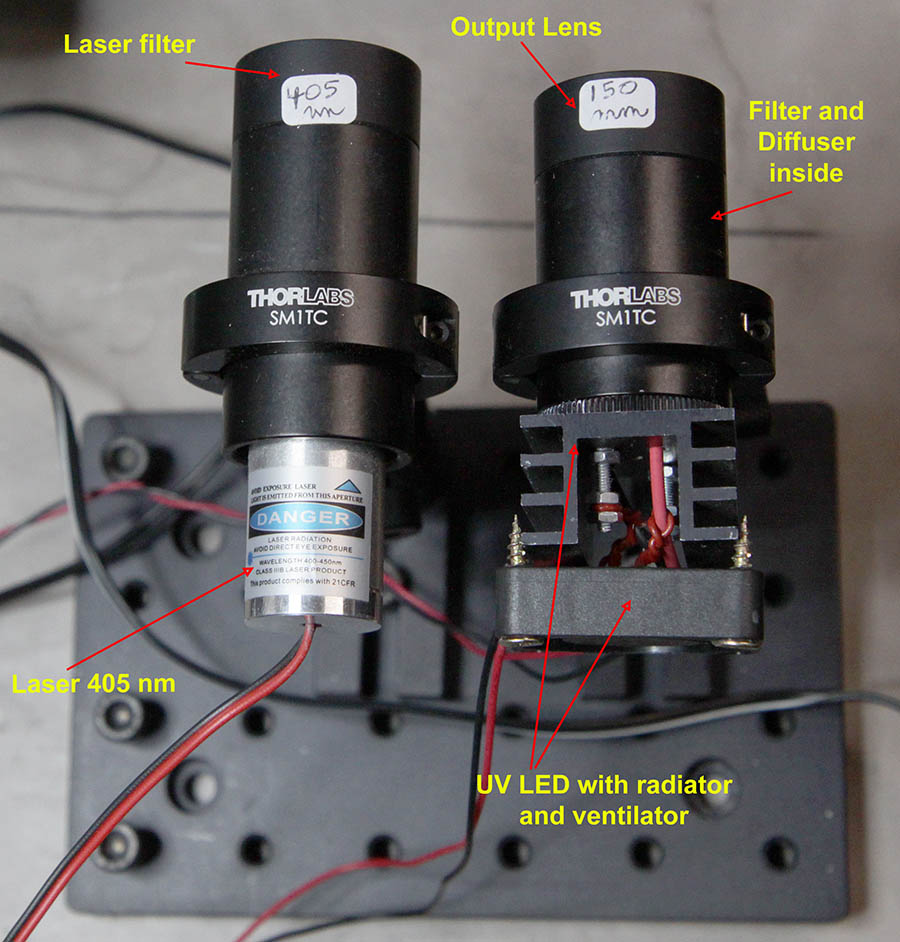
Figure1: UV sources. The image on the left illustrates the construction of two UV light sources to be added to the microscope for fluorescence imaging and spectra. The left source is a 405 nm laser secured in a Thorlabs SM1 mounting tube. A 390 nm OD6 band pass filter from Edmund optics is placed at the end of the tube to isolate the laser line. A 450 nm barrier filter (FELH0450 from Thorlabs) is introduced in the column of the microscope to avoid the UV light in pictures or spectra. A 150 mm or 100 mm focal length lens can be screwed at the apex of the tube to focus the light for reflection spectra or images recording. The right source has been build around a UV LED 365 nm wavelength (LZ4-04UV00 from LED ENGIN, see picture below). The LED is powered by a ESS015W-0700-18-Z1 supply from ERP power. To remove the heat generated by the LED, a radiator is attached on the LED mounting plate and a small ventilator is used to cool down the assembly. A 370 nm band pass filter (Edmund 86-348) is placed inside the tube to remove all visible light from the source. A ground glass diffuser in the tube is used to avoid the image of the LED onto the microscope stage and thus to get an homogenous lightning of the field of view. A 150 mm lens at the end of the tube focus the light on the microscope stage. A 400 nm long pass filter (Thorlabs FEL 0400) is introduced into the accessory slit of the microscope column to completely remove the UV light from images or spectra.
|
|
|
|
|
|
|
|
Figure 2: emission spectra of the UV sources. The two emission sources must be cleaned by an appropriate filter to avoid light emission in the visible part of the spectrum. The second order of the grating is clearly seen especially in the laser spectrum. For fluorescence as the light of the source is filtered out, the second order does not appear in the fluorescence spectra.
|
|
|
|
|
|
Figure 3: correction of the glue fluorescence in transmission spectra. The thin sections are glued to a glass plate. If the UV light pass through the section, fluorescence of the glue appear in the spectra and images. This fluorescence is blue as can be seen on the spectrum above. The raw spectrum in the wollastonite section has been corrected for glue luminescence by subtraction. To minimize this side effect, the fluorescence spectra can be taken in reflection rather than transmission.
|
|
|
|
|
|
Figure 4: Color spectrum image of sodalite.
|
|
|
|
|
|
Figure 5: Corrected fluorescence reflection spectra of a selection of rocks in thin sections. All spectra intensities have been normalized to peak maximum. The spectra of 2 fluorescent dyes have been added to the series. Pictures of the fluorescent minerals can be seen here.
|
|