Microscope fiber optics spectrometer
![]() Previous
Page 2:
example spectra.
Previous
Page 2:
example spectra.
| This section is the description of the construction of a new spectrophotometer for microscope to record absorption and reflection spectra of minerals. The idea was to develop a flexible instrument which could be connected quickly to the microscope. The use of an optical fiber is the key of that flexibility. The illumination of the entrance slit of the spectrometer is coming from the the photo port of the microscope through the fiber. This arrangement allows a quick replacement of the accessory in this port in order to connect different cameras, small spectrograph or photometer leaving the spectrometer in place.
|
|
|
|
|
|
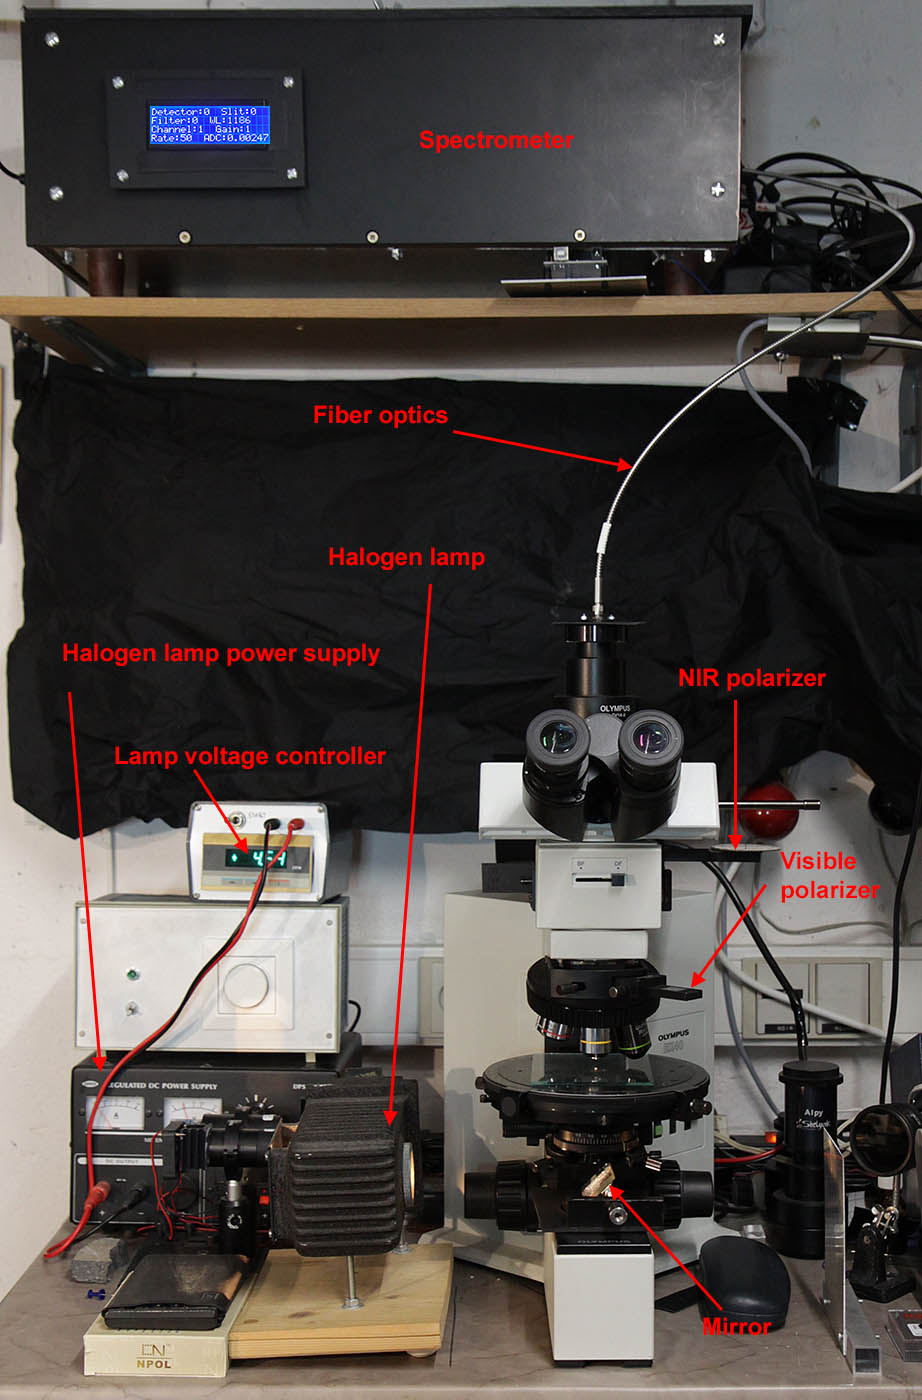
Figure 1: general view of the spectrometer connected to the microscope. The spectrophotometer is positioned on top of the microscope on a shelf so that plenty of room remains free on the working bench to facilitate the manipulation of the microscope. The entrance slit of the spectrometer can be illuminated by two different sources. For transmission, there is an halogen source (100W) positioned on the table to the left of the microscope. The light is sent to the stage via a 45° mirror. For reflection measurement of opaque minerals, the epi-illuminator in the column of the microscope can be used. The absorption or reflection spectra of minerals are generally recorded with polarized light. On a previous version of my spectrometer, I had built a calcite Nicol polarizer which could be used in a wide range of wavelength. This kind of polarizer cannot be used in the present arrangement because it is to much cumbersome. The purpose of this instrument is to reach a large wavelength range from 400 nm to more than 2000 nm. A normal microscope polarizer can be used from 400 to around 700 nm. To extent the wavelength coverage, I'm now using three polarizers, two at a time, positioned in the two accessory slots in the microscope column. The three polarizers are: from 400 to 700 nm: an Olympus accessory, from 700 to 1700 nm: a Thorlabs LPNIRE100-B and above 1700 nm a Thorlabs LPIREA100-C. The switch of the polarizers during the monochromator scanning is manual, the software stops the scan and ask for the change. The fiber adapter is made with an Olympus CMAD3 accessory connected to the fiber with a Thorlabs SM1SMA Series Fiber Adaptor. This equipment can be easily replaced by another CMAD3 to place a camera for instance in the microscope column. The optical fiber is also coming from Thorlabs, it is a BF20LSMA01 2.0mm diameter bundle, LOW OH, SMA connection, 1m length to be used in the visible-NIR range.
|
|
|
|
|
|
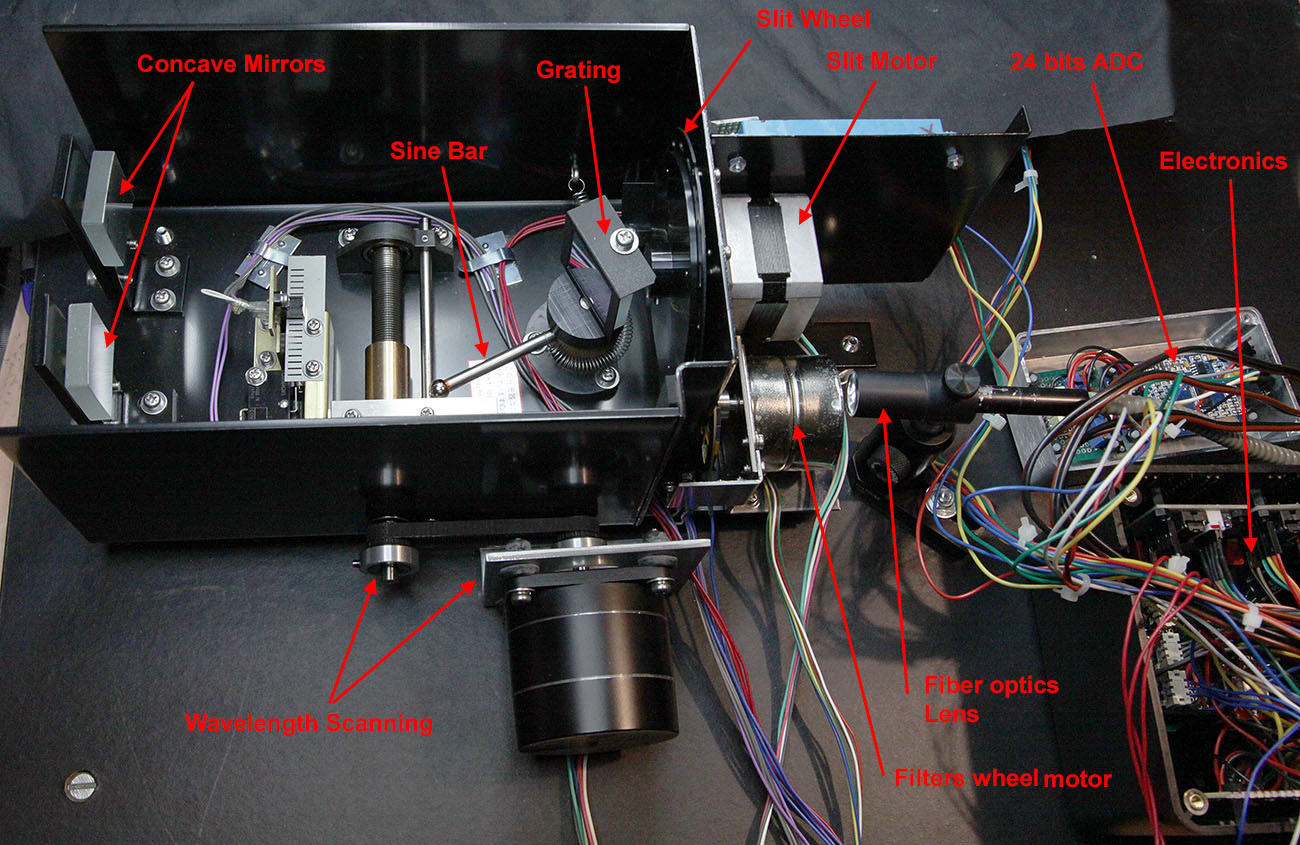
Figure 2:Detailed view of the monochromator. The monochromator is coming from an old UV-Visible spectrophotometer out of work. It is a Cerny-Turner mounting with a sine bar to rotate the grating. The drive mechanism for the wavelength scanning is actuated by a stepper motor and a belt. The monochromator is equipped with a filter wheel and a slit wheel each controlled by a stepper motor. The light coming from the optical fiber (from the right side) is focused onto the entrance slit by a lens. To reach the filters and slits zero points, a notch cut in the wheels is detected by an optocoupler. To find the wavelength zero point, three steps are necessary: 1: rewind the mechanism until a switch is actuated. 2: the rotation of the system is reversed until an optocoupler is actuated by the metal comb seen on the picture at the left of the sine bar. 3: the zero order of the grating is then sought (see below). The original grating (1600 lines / mm) has been replaced by a 600 grooves / mm from Edmund optics (#55-258) to increase the wavelength coverage from 400-900 nm originally to 400-2500 nm. At the output of the monochromator, 3 photodiodes have been positioned on a turret. They are not visible on this picture.
|
|
|
|
|
|
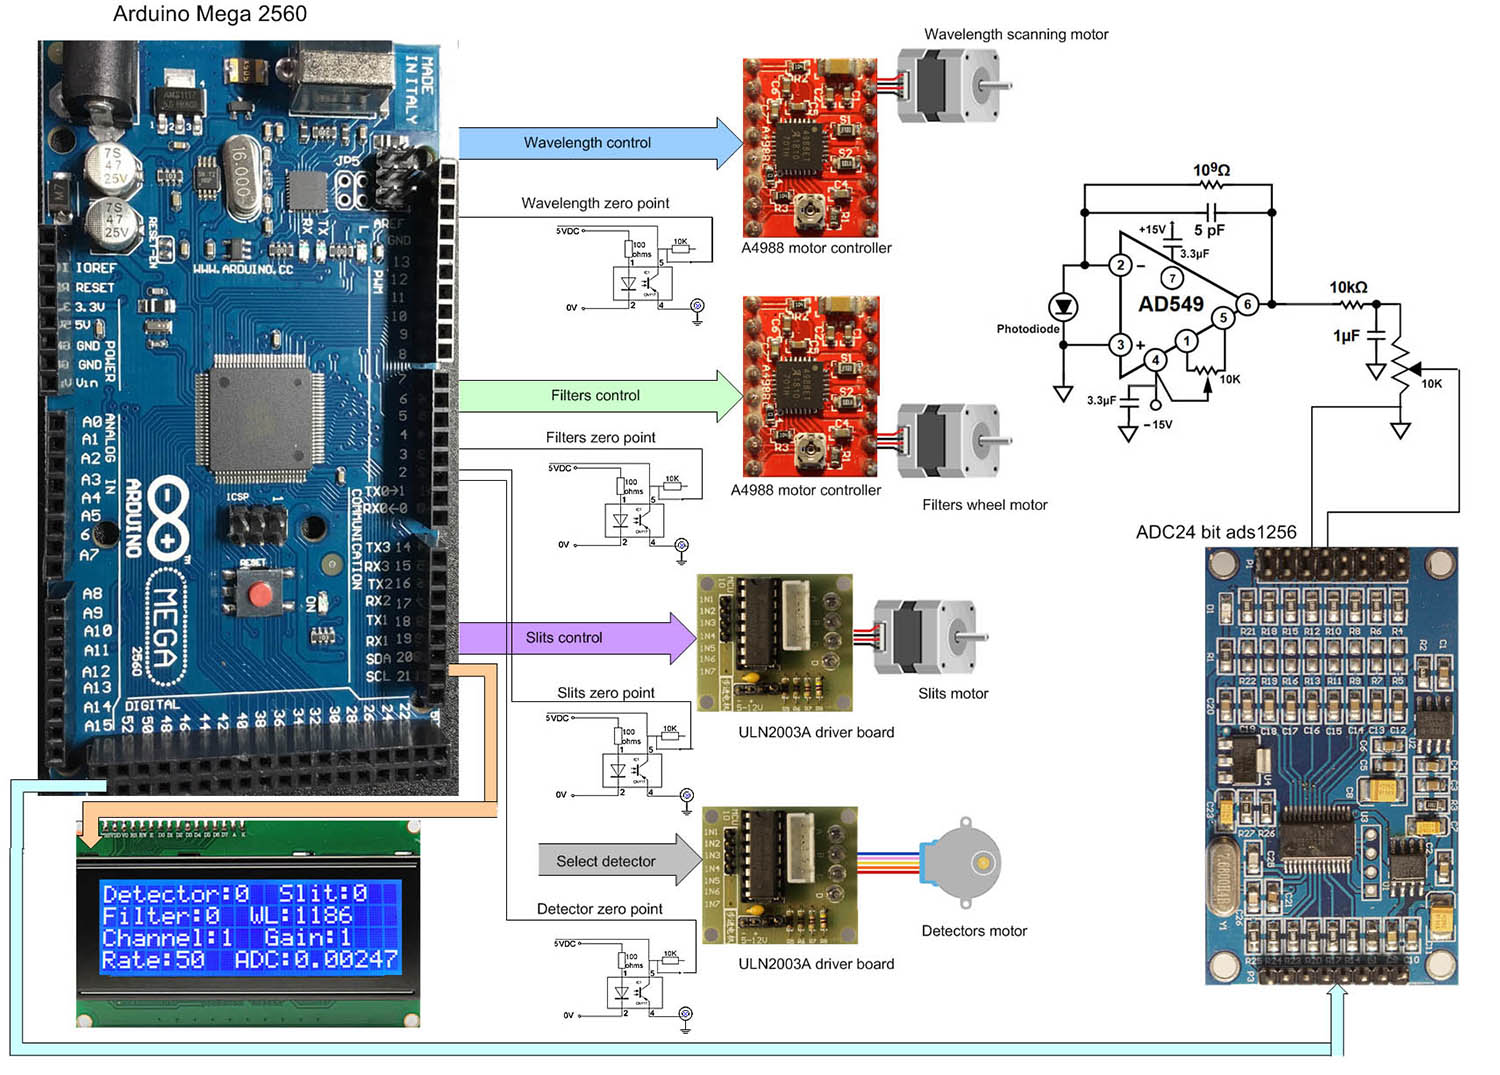
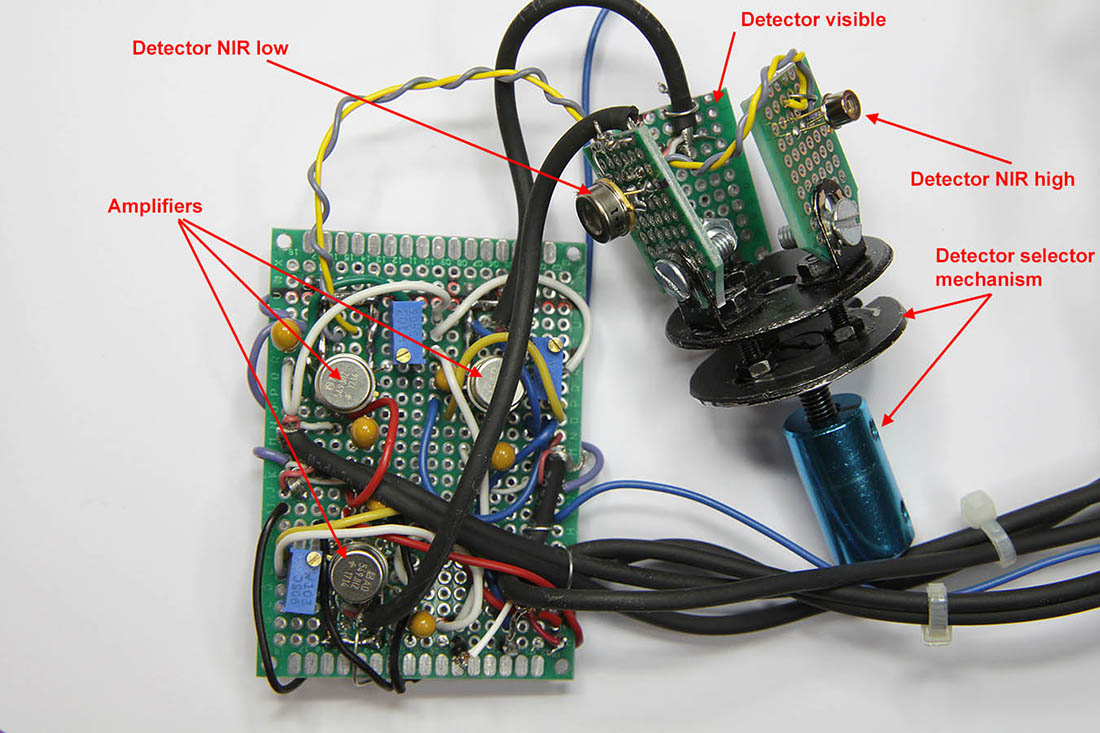
Figure 3: schematic of the internal electronics for the control of the system. The spectrometer control and data acquisition are organized around an Arduino Mega 2560 which contains the firmware with the different low level commands. The microcontroller receives its commands from a PC Excel program connected by USB. The mechanical adjustment of the different moving parts of the system is performed by four stepper motors as indicated in the schema above. Two motors are bipolar, they are actuated by a small A4988 driver board powered by a 31V supply (not shown). The slits and detectors motors are unipolar, driven by a ULN2003A board ( 5V and 12 V power supply). A display is also connected to the microcontroller to give the operator all information about the low level operations performed by the controller. On power up, a reset of the system is made to find the zero point of each device: grating, filters, slit wheels and detectors turret. The zero points are found with the help of optocouplers installed on each wheels. The light at the exit slit of the monochromator is detected with 3 photodiodes from Thorlabs: an FD11A silicon photodiode to cover the range 400 to 1050 nm, an FGA20 InGaAs photodiode in the range 700 to 1700 nm and a FD10D InGaAs above 1700 nm. The FD10D photodiode is difficult to use due to its high dark current which prevent a high gain of the output amplifier so it has a low sensitivity and a poor stability. I do not advice such a detector. As the light throughput of the microscope do not exceed over 2100 nm, a photodiode with a slightly reduced wavelength range and lower dark current should be sought. Each photodiode has its own amplifier made around an Analog Device AD549 as illustrated in the figure 3. The amplified signal is fed through a filter and attenuator to an analog to digital board ads1256. This ADC component has a 24 bit resolution and symmetrical input. It has also a programmable amplifier on each input and it is controlled by the MEGA2560.
|
|
|
|
|
|
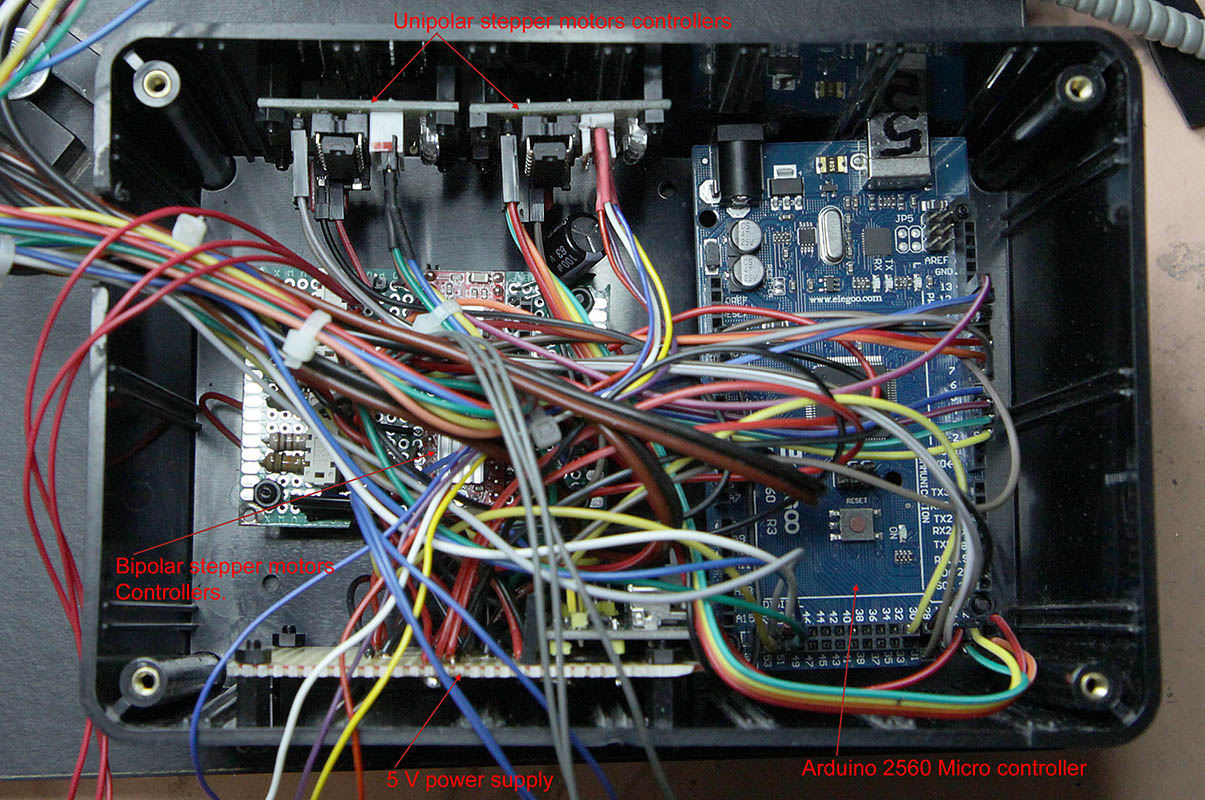
Figure 4: Detail of the internal electronics. The microcontroller is positioned on the right side. On the left, one can see the small stepper motor controllers, power supply and optocoupler electronics. They are almost hidden behind a high amount of wires. The whole electronics is enclosed in a black plastic case to avoid any spurious light in the spectrometer. The ADC is encased in a metal box, it is partly visible in figure 2 on the right.
|
|
|
|
|
|
Figure 5: view of the 3 detectors turret and home made photodiode amplifiers. The photodiodes are mounted on small circuit boards and connected to the amplifiers by loose wires to allow the rotation of the assembly. A notch has been cut in the lower disk to be used together with an optocoupler for the zero point positioning. The blue cylinder at the bottom of the turret is the connector to the stepper motor not shown.
|
|
|
|
|
|
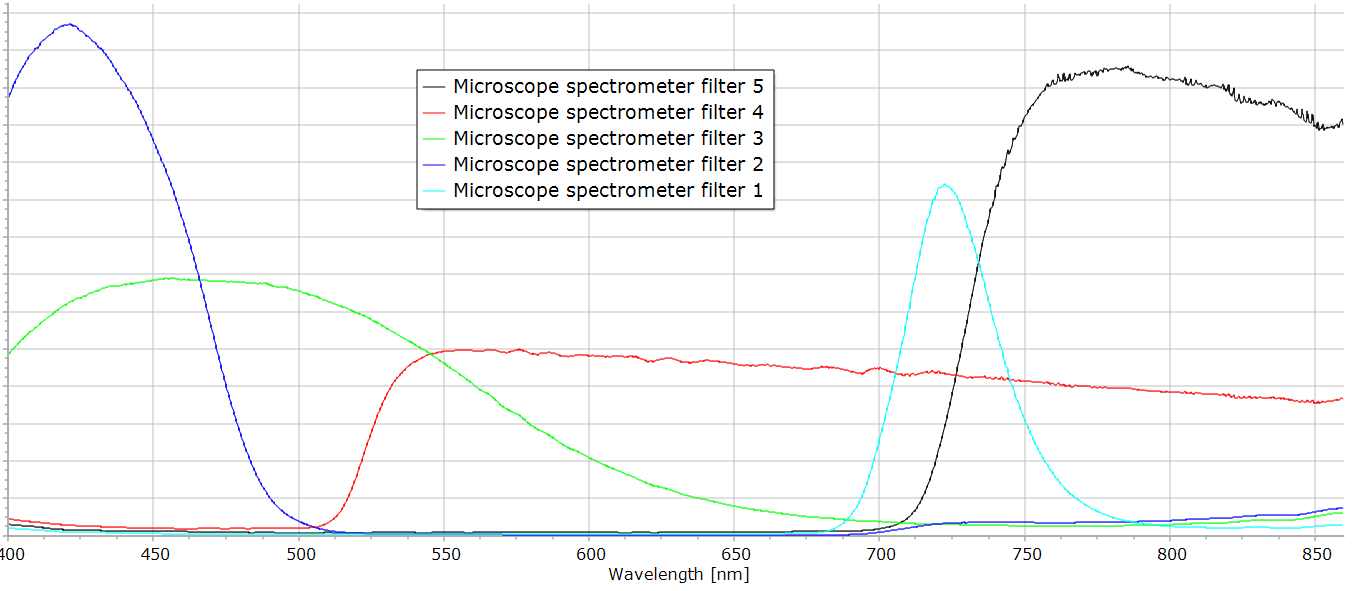
Figure 6: transmission of the filters used in visible range of the fiber optics spectrometer measured with the Alpy 600 spectrograph. The filter 1 is not used in this application. Filter 2 is used from 380 to 460 nm to remove the stray light in the spectrometer because in this range the transmission of the microscope grating and source is rather low so the parasitic light coming from the outside of this range could affect the results. Filter 3 is used from 460 to 530 nm. Filter 4 from 530 to 810 nm where the light throughput of the spectrometer is high. Filter 5 is generally replaced by filter 6, a 800 nm long pass filter from Edmund optics (filter 6) in the range 800-1300nm. Filter 5 can nevertheless be used above 750 nm with visible detector. Filter 7 is a long pass 1300 nm filter from Edmund optics used above 1300 nm.
|
|
|
|
|
|
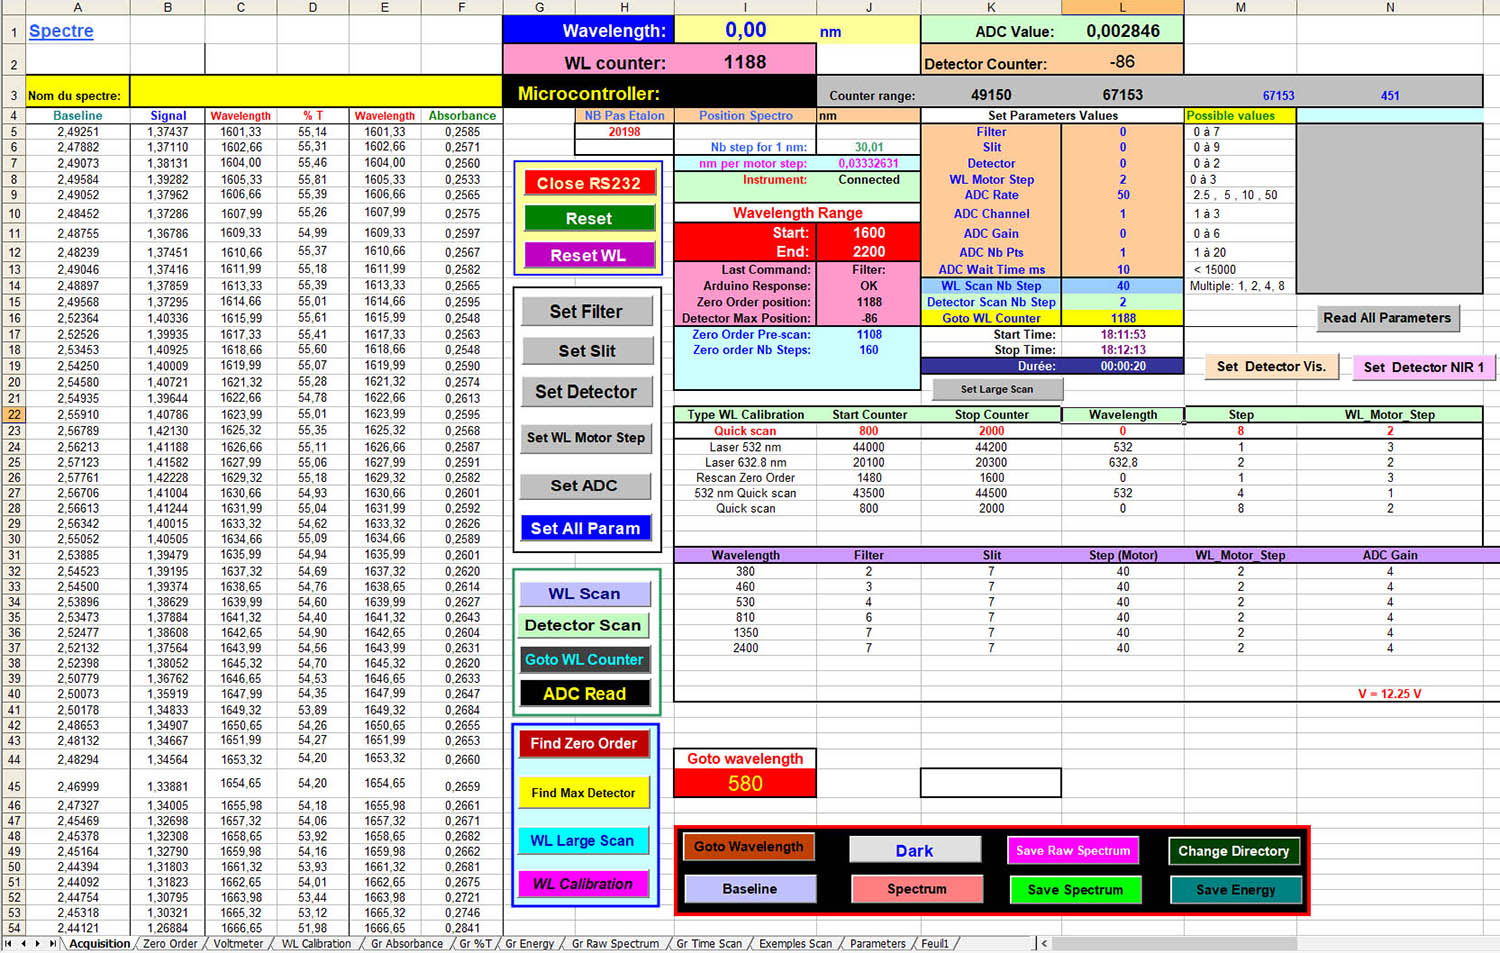
Figure 7: layout of the Excel program which control the spectrometer functions and data acquisition. This panel contains a lot of buttons to actuate the different functions of the spectrometer. Buttons on the left are the low level actions to a specific device of the system: for instance filter position, slit position, grating motion.... The buttons on bottom right are high level function to record a full spectrum and acquire the data. All parameters to setup a scan and response of the spectrometer are also displayed on this sheet.
|
|
|
|
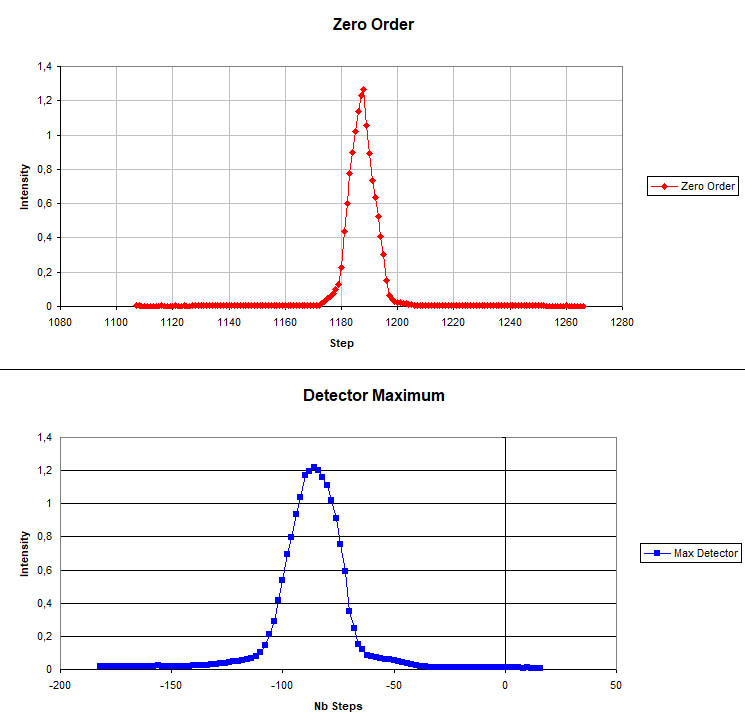
Figure 8: zero order and detector position window. These two functions are coupled together: first, the grating is scanned around the zero order position to find the maximum intensity but as the detector can be changed, the best position of the detector must be sought afterwards at the first zero order found position to maximize the signal. These two functions are generally executed repeatedly 2 or 3 times to ensure that the system is working in the best conditions. The zero order is the starting position to calculate the wavelengths. The monochromator wavelength must be calibrated, I have used an helium neon laser to do it. |
Previous Page 2: example spectra.
