Fiber Optics Spectrometer. Example Spectra.
|
|
|
Figure 1: contrast filter used in astronomy. Spectrum of a Baader filter used in astrophotography to increase the contrast. It is a Praseodymium-Neodymium filter with numerous absorption bands. The figure compares the microscope spectrometer to a Shimadzu 2600 spectrophotometer which is not coupled to a microscope. The Shimadzu has a resolution advantage but the wavelength range is limited to 900 nm.
|
|
|
|
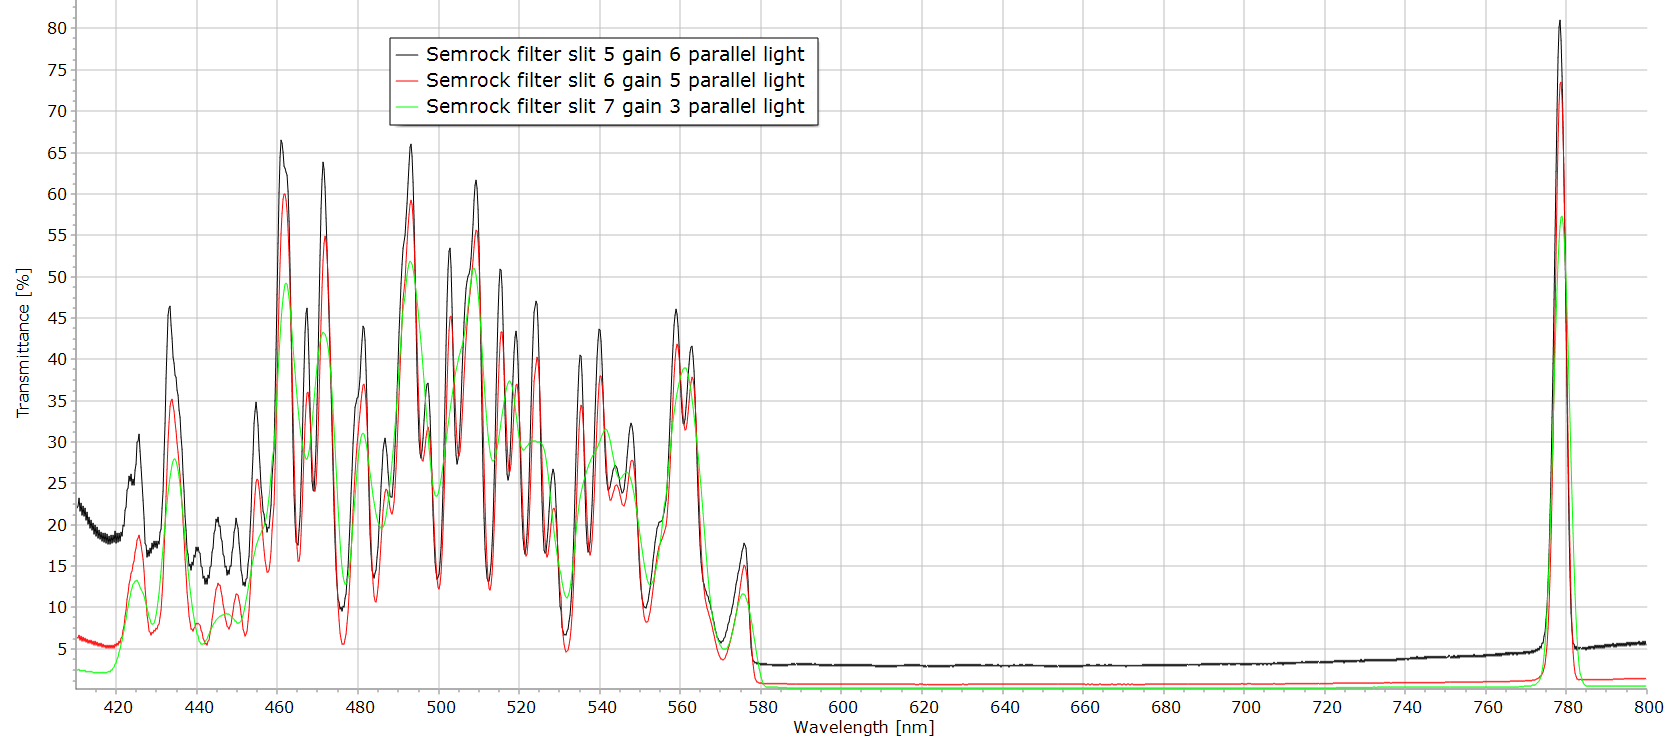
Figure 2 : Semrock filter used to isolate the 780 nm line of a diode laser. This Semrock filter is used in Raman spectroscopy to clean the line of a 780 nm diode laser. It is an interference filter. The spectrum above 600 nm gives only the line at 780 nm but below 580 nm a great amount of lines can be seen. The figure above illustrates the spectrum change when the entrance and exit slits are narrower. The slit 7 is very wide (~ 5 nm resolution) and thus gives a poor resolution spectrum. Best resolution is obtained with slit 5. The figure 3 reproduces the spectrum obtained with a Shimadzu 2600 spectrophotometer. The resolution is this time much better. To explain this difference in resolution two arguments must be considered: 1: the luminosity of the microscope spectrometer is much lower due to the microscope throughput and the fiber optics coupling thus the narrower slits are difficult to use; 2: the interference filters should be used in a parallel light beam, this condition is fulfilled in the Shimadzu instrument but the microscope is using a highly convergent beam to maximize intensity.
|
|
|
|
Figure 3 : Semrock filter 780 nm on a Shimadzu 2600.
|
|
|
|
|
|
Figure 4 a and b: Epidote crystals. Two single crystals of epidote. The spectra are given as a function of wavelength and wavenumbers. Such spectra have already been recorded with another spectrometer.
|
|
|
|
|
|
Figure 5: Gypsum NIR spectrum 800 - 1700 nm. Spectra of gypsum sections recorded with the detector 700-1700 nm.
|
|
|
|
|
|
Figure 6: gypsum NIR spectrum, long wavelength range. Gypsum thinner section spectrum recorded with the third photodiode 1500-2100 nm. The peaks at 5200 cm-1 have a much greater absorbance than the peaks in previous spectra.
|
|
|
|
|
|
Figure 7: forsterite in a pyroxenite section. Forsterite crystal spectra with the NIR detector 700-1700 nm. Spectra can be compared to results with another spectrometer.
|
|
|
|
|
|
Figure 8: ortho pyroxene in a pyroxenite section. Composite spectra (detectors 1 and 2) of ortho-pyroxene. Those spectra have already been recorded with previous instrument.
|
|
|
|
|
|
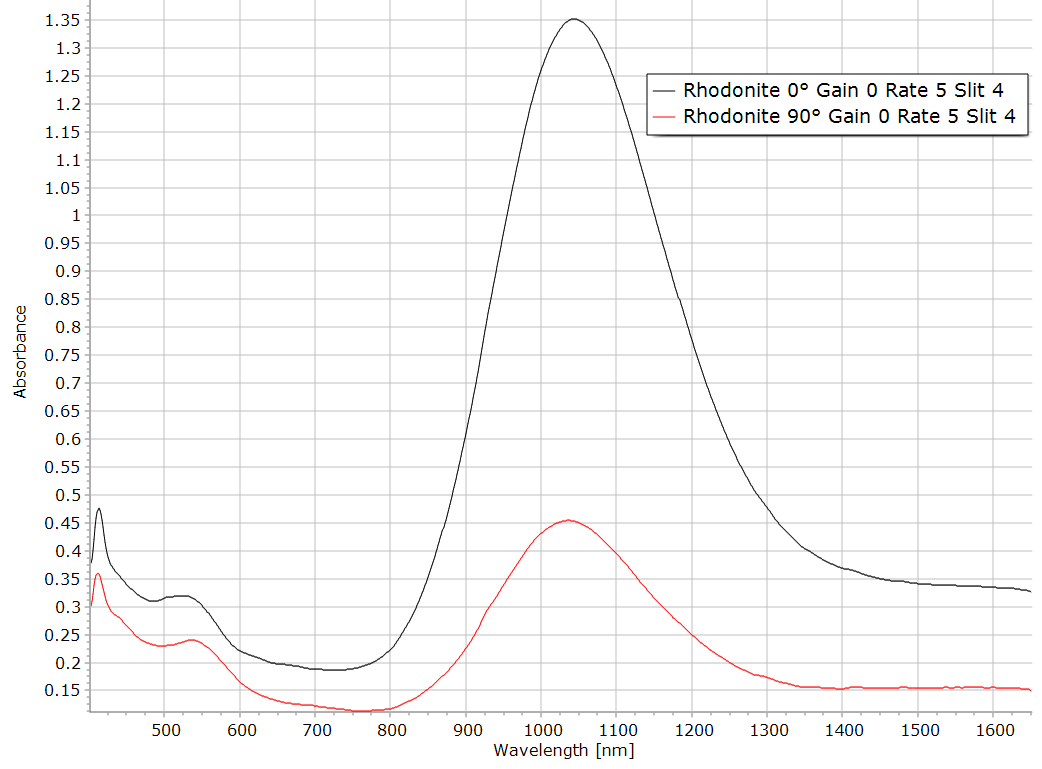
Figure 9: Rhodonite section Composite spectra of a Rhodonite section (Mn pyroxene). The absorption band around 9600 cm-1 could be due to the presence of a high concentration of iron II in this pyroxene.
|
|
|
|
|
|
Figure 10: Ruby absorption spectra. Ruby absorption spectra with detector 1 visible, grating 1600 grooves / mm limited to 900 nm. Spectra recorded for two orientations of the section showing the pleochroism of ruby. The negative peak at 15500 cm-1 is in fact fluorescence because the sample is always illuminated by the whole wavelength range of the source in this kind of spectrometer. The fluorescence at 15500 cm-1 is produced by the blue light of the source. As fluorescence is an emission, it appears thus negative in an absorbance spectrum. Ruby has already been examined with a previous model of spectrometer.
|
|
|
|
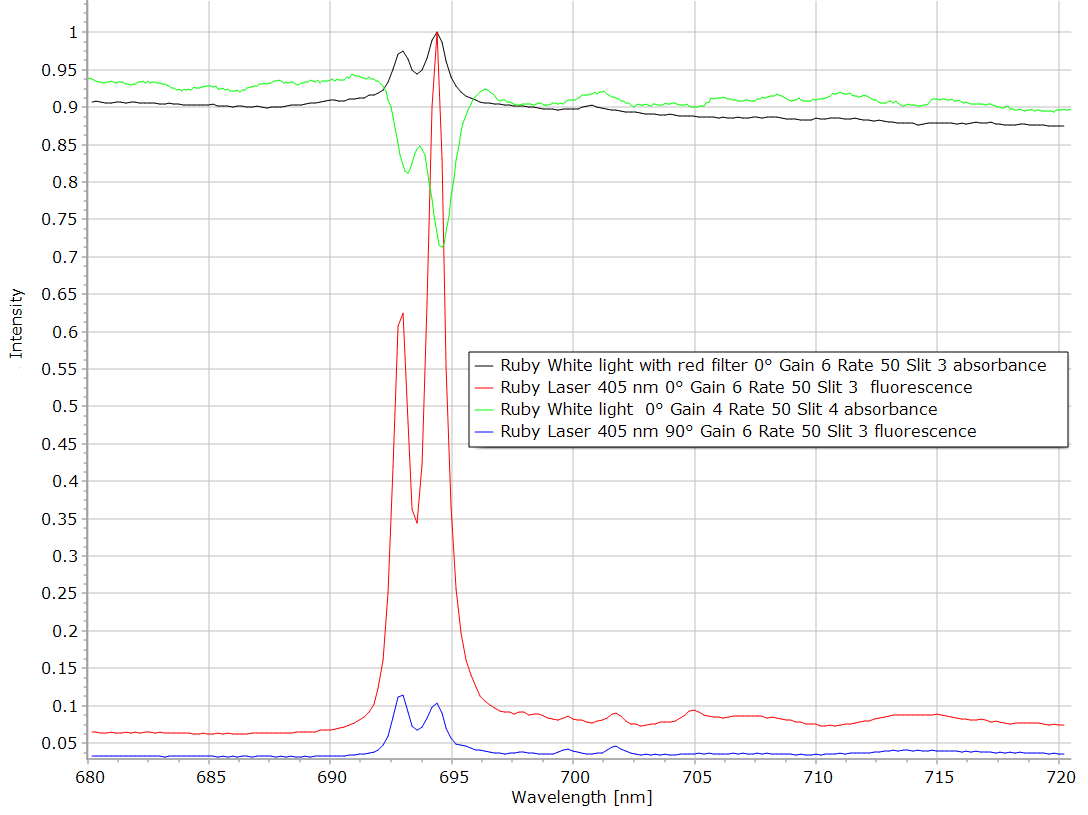
Figure 11: Absorbance-fluorescence spectra. Ruby. Detail of the band close to 700 nm at higher resolution. The green curve in figure 11 is the fluorescence recorded with white light as the source. The peak is negative because fluorescence in an emission and not an absorption. If a red filter is placed between the source and the spectrometer, no fluorescence is emitted and the spectrum is now a real absorption (black curve). The red and blue curves are fluorescence emission excited by a violet laser at 405 nm. It is seen that the polarized fluorescence varies according to the orientation of the crystal
|
|
|
|
|
|
Figure 12: reflectance spectra of opaque minerals. The two graphs above are examples of reflectance spectra of opaque minerals recorded with the new fiber spectrometer. A reference must be chosen to transform the raw reflection into a reflectance spectrum. In those examples, metallic iron from a meteorite has been selected.
|