Epidote Spectra.
|
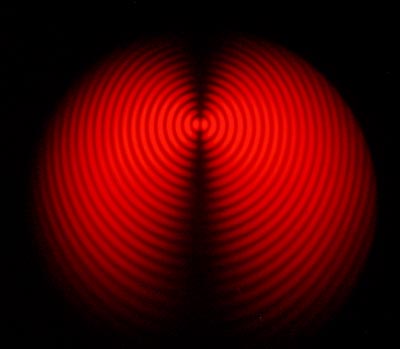
Fig.1. Conoscopic image of a section parallel to Y axis in an epidote crystal. The section is nearly normal to an optic axis. |
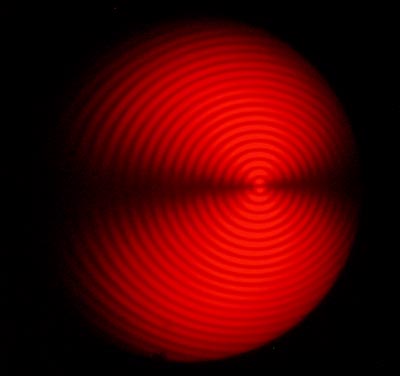
Fig.2. Same section rotated by 90°. The optic axes angle 2V is close to 90°. |
|
|
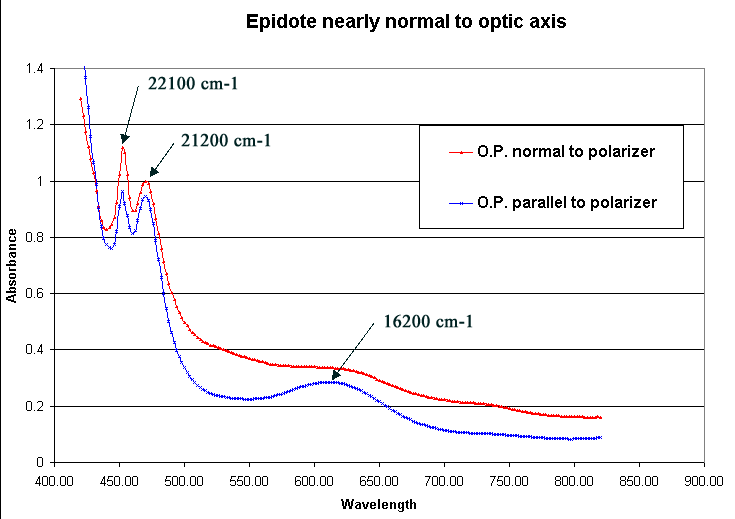
Fig. 3. Polarized spectra of the section described above. Crystal with orientation of figure 1 is Yellow, it gives the b spectrum (red curve). The orientation of figure 2 is green, it gives a mixed spectrum (blue curve). The thickness of this section is 0.4 mm. The spectra in this figure were recorded with an 0.5 mm entrance slit to increase the resolution. |
|
|
|
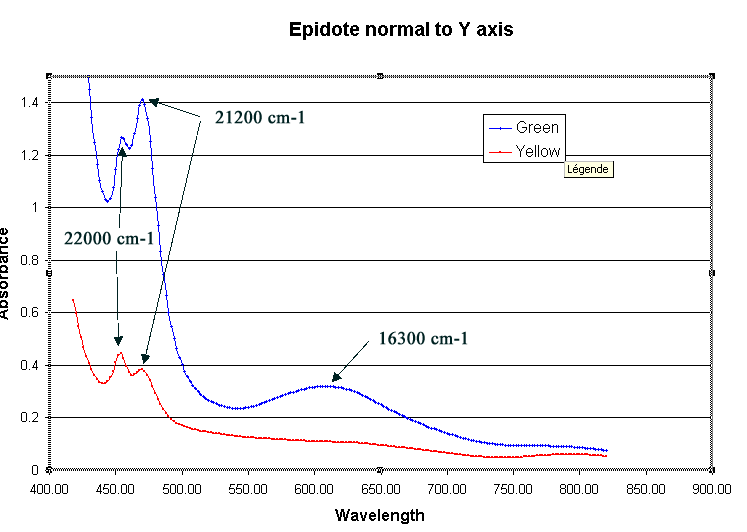
Fig. 4. Section normal to Y axis. It gives the g spectrum (green) and the a spectrum (pale yellow). The thickness of the crystal is 0.4 mm. |


