Conoscopy of Biaxial Minerals (4).
Accessory plates.
1. Wave plate and quarter wave plate for a 45 ° orientation of the optic plane.
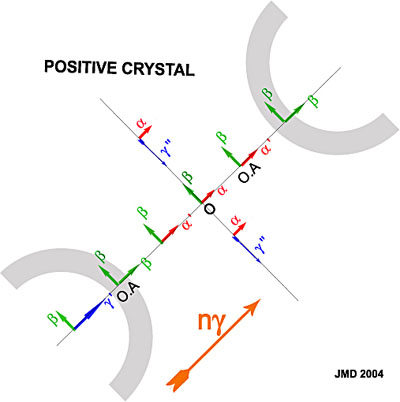
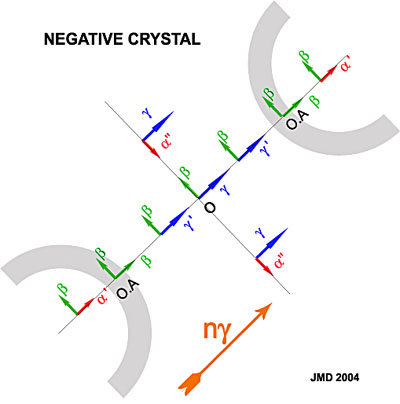
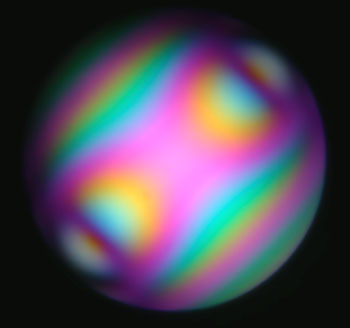
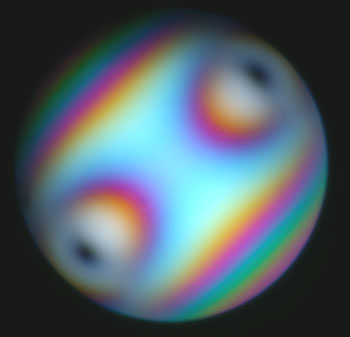
A diagram of a biaxial conoscopic figure with projection of the refraction indices for positive and negative crystals oriented at 45° from polarizer direction, parallel to the large refractive index of the accessory plates is presented in figures 1 and 2. The figures were obtained by a simple rotation of the general map of the indices obtained from the biaxial indicatrix as explained on the introduction page. As images below illustrate the figures obtained with muscovite a negative crystal, we'll consider first the case depicted in figure 2. Traces of the hyperbolic isogyres have also been drawn in the figures. On the trace of the optic plane, between the melatopes (poles of the optic axes) large index g' is always parallel to the large index (ng) of the accessory plate when introduced in the microscope tube. This is also true on the region normal to the optic plane, only the small index b is replaced by a still smaller index a'. When an accessory plate is introduced, there is an addition of the retardations of accessory plate and crystal between the melatopes. Beyond the poles of the optic axes, the retardations subtract. If we consider now the indices diagram of a positive crystal in figure 1, we can see that the opposite is now true: between the melatopes, the retardations of the accessory plates and crystal subtract and add each other beyond the optic axes. If we now rotates both figures by 90 ° ( optic plane normal to large index of accessory plates), the regions where the subtraction occurred are now in a position of addition of the retardations. With this in mind, it is possible to explain the different images below.
|
Figure 1. Conoscopic figure of a biaxial positive crystal with optic plane oriented at 45° from polarizer direction. |
Figure 2. Conoscopic figure of a biaxial positive crystal. |
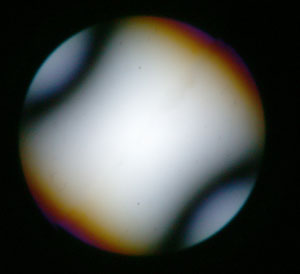
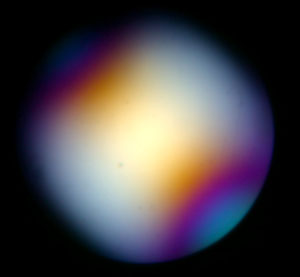
In figures 3 and 4, a thin section of muscovite in two different positions has been photographed. These very thin sections have thickness close to the 30 µ standard of the rocks thin sections. They give thus conoscopic figures similar to the ones that can be observed on such standard sections.
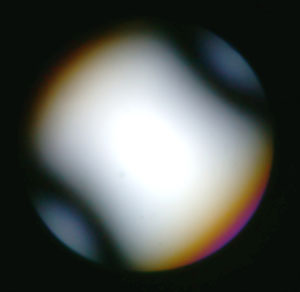
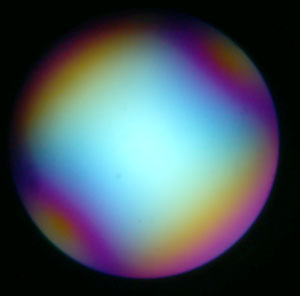
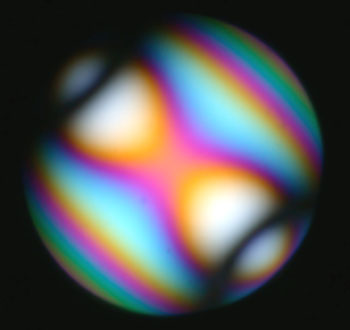
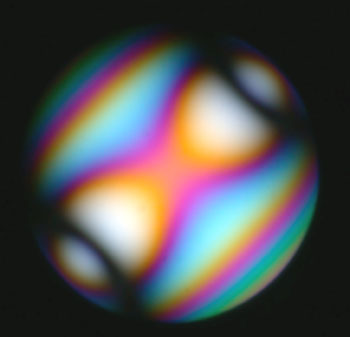
With the addition of a wave plate, the increase of the retardation in figure 4 b (appearance of a blue color) between the hyperboles of the isogyres, indicates clearly that muscovite has a negative optical sign. In figure 3b, the retardations addition is replaced by a subtraction so retardation decreases between the melatopes (appearance of a yellow color). To assign the optical sign with a wave plate, locate the yellow or blue colors positions close to the isogyres and compare to the figures below.
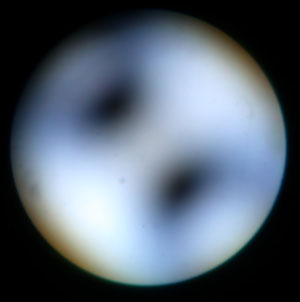
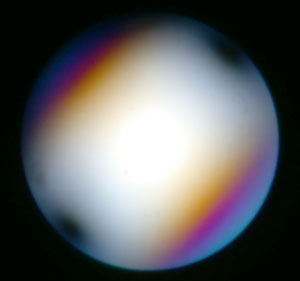
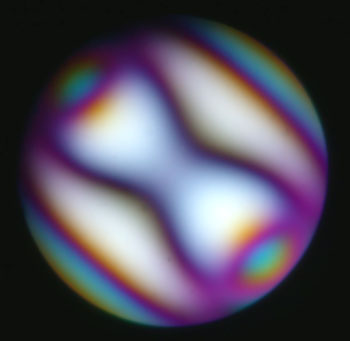
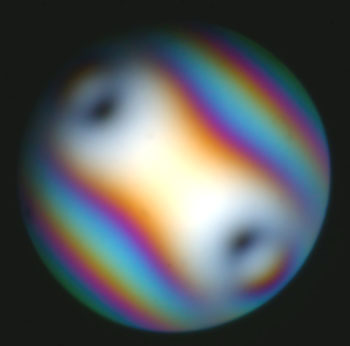
With a quarter wave plate when the crystal is in the position of figure 3a, we have a subtraction between the hyperbolae. As the birefringence increases from the pole of the optic axis towards the center of the figure, there should be a point on that line where retardation of the crystal is just canceled by the quarter wave plate.( If the section is not so thin or the partial birefringence (g - b) is not so small that the retardation at the center of figure is not lower than a quarter wave). These two center symmetric points are of course black (see figure 3c). They are located between the melatopes for a negative crystal with optic plane normal to accessory large index. If the crystal is rotated by 90°, their position is beyond the poles of the optic axes like figure 4c. The reverse is true for a positive optical sign. If the retardation at the center of the conoscopic figure is just a quarter wave then, after introduction of the quarter wave plate, the dark spots should be located at the center. To assign the optical sign with a quarter wave plate, determine if the black spots (if any) are located between or beyond the poles of the optic axes.
|
Figure 3a. Muscovite crystal cut (negative) normal to acute bisectrix with 45° orientation. Optic plane perpendicular to accessory large refractive index. |
Figure 3b.Same crystal as in 3a with addition of wave plate. |
|
Figure 3c.Same crystal as in 3a with addition of quarter wave plate. |
Figure 4a. Muscovite crystal cut (negative) normal to acute bisectrix with 45° orientation. Optic plane parallel to accessory plate large refractive index. |
|
Figure 4b.Same crystal as in 4a with addition of wave plate. |
Figure 4c.Same crystal as in 4a with addition of quarter wave plate |
The figures 5 and 6 depict the same situation for a higher thickness crystal plate. With the wave plate, low interference colors lie between the optic axes in figure 5b, a zero order lemniscate is even visible. The small yellow spots along hyperbolae in figure 5b indicate a negative optical sign. Figure 6b, after 90° rotation, shows high interference colors between the melatopes. With the quarter wave plate, we also see low interference colors in figure 5c between optic axes and high interference colors in figure 6c. The dark spots are located closer to the optic axes poles. If we rotate the crystal, they turn around the optic axis.
|
Figure 5a. Muscovite crystal cut (negative) normal to acute bisectrix with 45° orientation. Optic plane perpendicular to accessory large refractive index. Higher crystal thickness than figures 3 and 4. |
Figure 5b.Same crystal as in 5a with addition of wave plate. |
|
Figure 5c.Same crystal as in 5a with addition of quarter wave plate. |
Figure 6a. Muscovite crystal cut (negative) normal to acute bisectrix with 45° orientation. Optic plane parallel to accessory plate large refractive index. Same thickness as figure 5. |
|
Figure 6b.Same crystal as in 6a with addition of wave plate. |
Figure 6c.Same crystal as in 6a with addition of quarter wave plate. |
