Conoscopy of Biaxial Minerals (5).
Accessory plates.
1. Wave plate and quarter wave plate for an optic plane orientation parallel to polarizer.
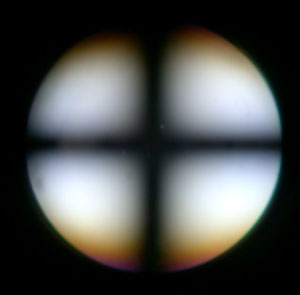
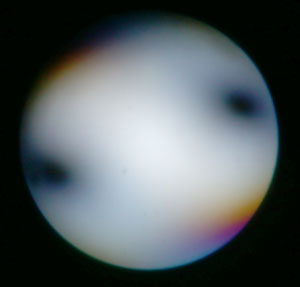
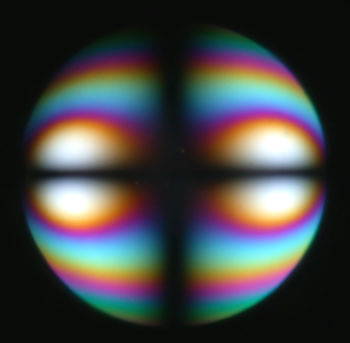
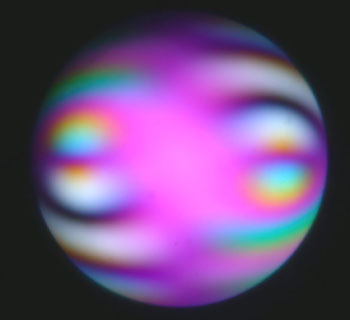
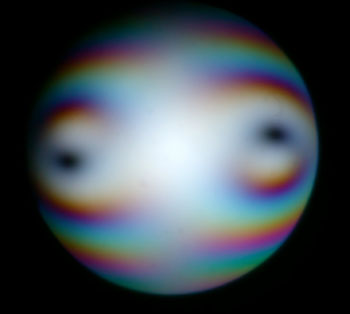
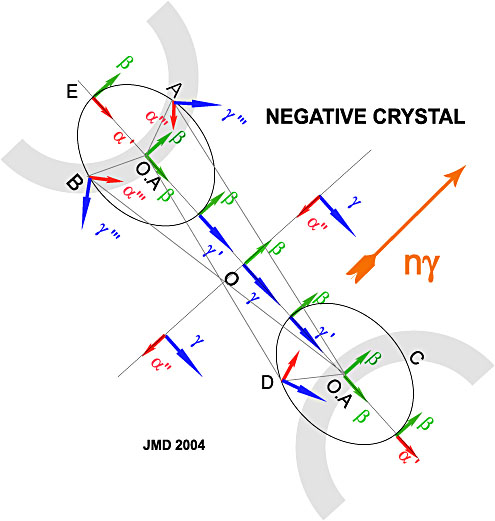
Figure 1 shows again the map of the indices of refraction in the conoscopic figure for an optic plane co-linear with polarizer. Points A and B around the melatopes have been added to the figure with their indices directions. Small index at point B (and point C because the figure is centro-symmetric) are parallel to ng the large index of the accessory plate and thus in a position of subtraction of the retardations of both plates. The introduction of a quarter wave plate gives thus two dark points in the vicinity of B and C due to retardations cancellation (see figure 2 b). For a positive crystal, the two dark spots should be at point A and its symmetric through center O because index g''' is replaced by a'''. If the thickness of the crystal or birefringence is higher, the dark spots are closer to the optic plane (figure 3c) and it becomes more difficult to see in which quadrant of the figure they occur. For thin crystals with moderate birefringence, it is possible to determine the optical sign from such a figure. Notice that the dark spots appear in the same quadrants as for uniaxial crystals of the same optical sign (but not on a 45° line). The addition of a wave plate gives the strange pattern shown in figure 3b. Observe again that the figure is centro-symmetric. The two dark arcs in the regions of points B and C are due to a subtraction of retardations in those places. The position of the yellow spots close to the optic axes can also be used to determine optical sign.
|
Figure 1. Map of the refraction indices for a biaxial crystal with optic plane parallel to the polarizer. |
Figure 2a. Muscovite thin crystal with horizontal optic plane. |
|
Figure 2b. Same crystal as 2a with quarter wave plate introduced. |
Figure 3a. Muscovite thicker crystal with horizontal optic plane. |
|
Figure 3b. Same crystal as 3a with wave plate introduced. |
Figure 3c. Same crystal as 3a with quarter wave plate introduced. |
3. Quartz Wedge.
|
|
Figure 4. Map of the refraction indices in the conoscopic figure to explain what happens when the quartz wedge is inserted in the microscope tube with its large index (ng) oriented as shown in the figure. |
With the indices map of figure 4, it is possible to imagine that with the continuous introduction of the quartz wedge, the low interference colors curves will move from the low birefringence regions to the high birefringence regions so from the optic axis towards center first and then along a line normal to the optic plane. All that zone is in a position of subtraction of the retardations. Beyond the isogyres hyperbolae, the interference colors increase.
This can be checked in the following quartz wedge movie.

