Spectrograph tests: Raman spectra of plastic materials.
 Next page
Raman Main Page
| To test the characteristics of the new spectrograph for Raman spectroscopy ( wavelength range available, sensitivity, vignetting, shape of spectra, spectral background...) I have chosen some plastic materials because the carbon containing molecules give vibration spectra at higher frequency than minerals and with such materials, the CH band around 3000 cm-1 can also be examined. See results on the figures below.
|
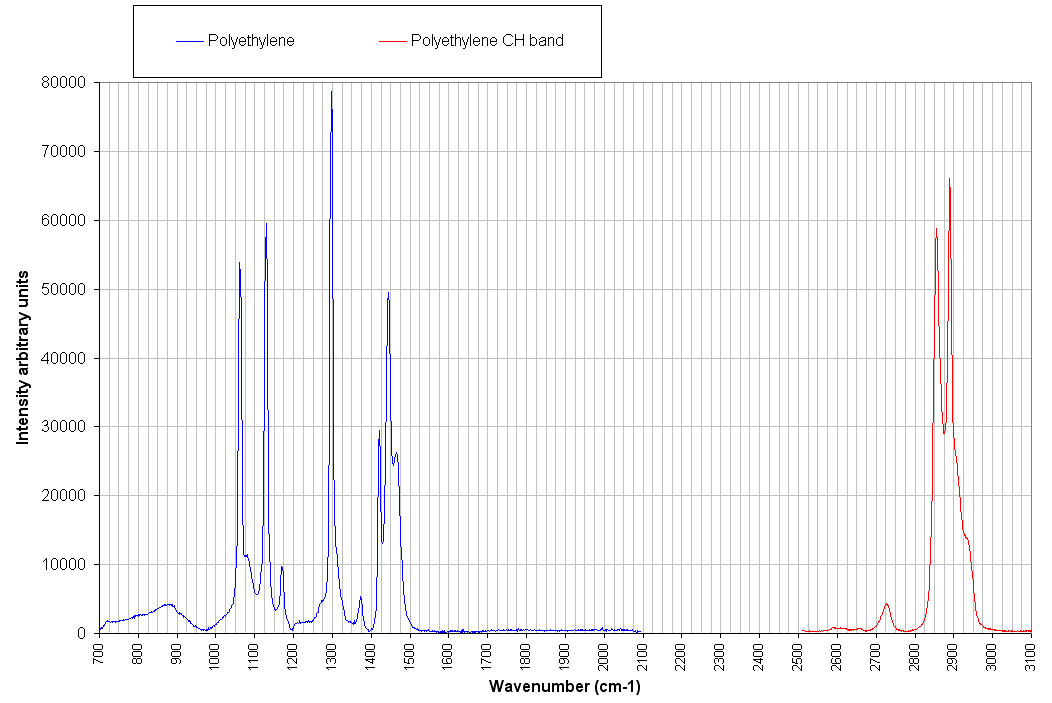
Raman Polyethylene
Spectrum of the cover of a lab polyethylene flask. Two spectra have been recorded in the low and high wavelength range. This spectrum is a typical polyethylene spectrum as can be found in the literature. The blue curve is C-C stretching vibrations and CH bending modes. Red curve is the C-H stretching vibrational modes.
|
Raman Polypropylene
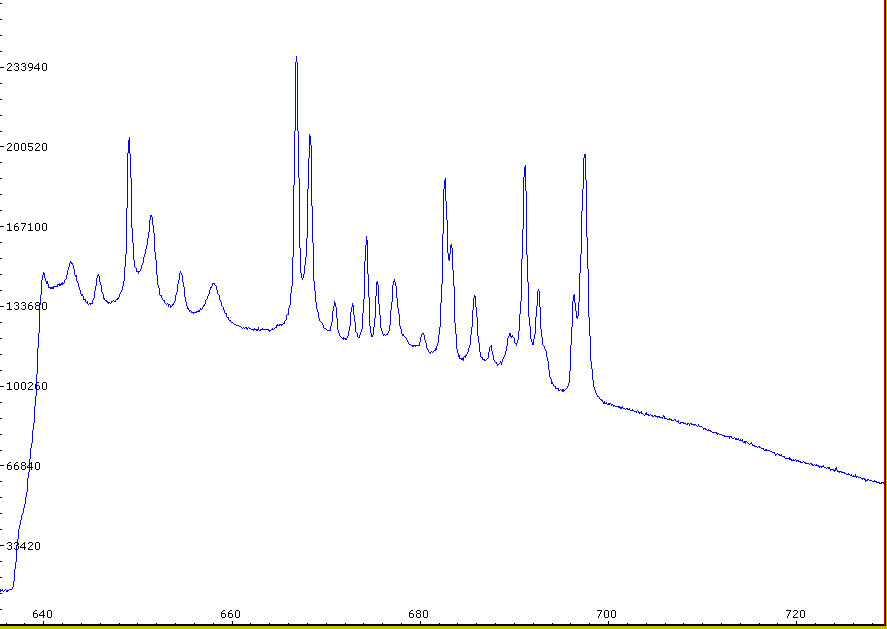
Polypropylene raw spectrum, Raman low range, as processed in Visual Spec program (scale in nm). This raw spectrum shows the improvement in the baseline and the absence of vignetting compared to spectra given by the H20 monochromator used in the first design of the Raman microscope.
|
|
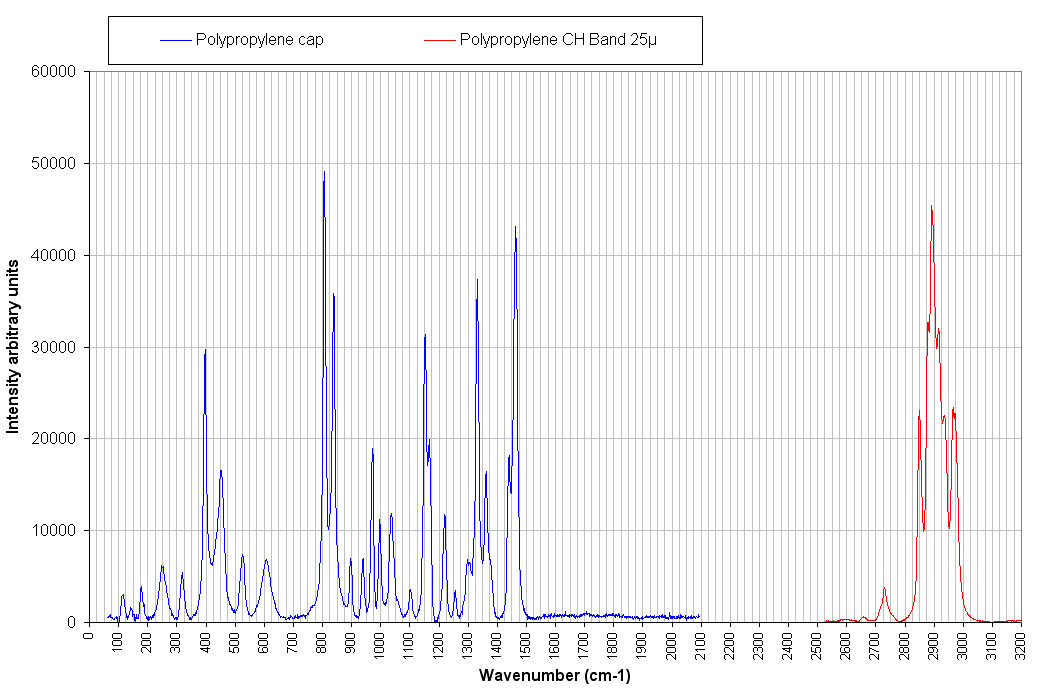
Processed spectrum of a polypropylene sample. This Raman spectrum is not a pure polypropylene but made of two components: the part above 700 cm-1 is really the polypropylene. The lower part below 700 cm-1 is a mineral filler made of TiO2 , a mixture of rutile and anatase. The red spectrum has been recorded with a 25µ slit to improve the resolution, it shows the details of the C-H stretching band. |
Raman PMMA
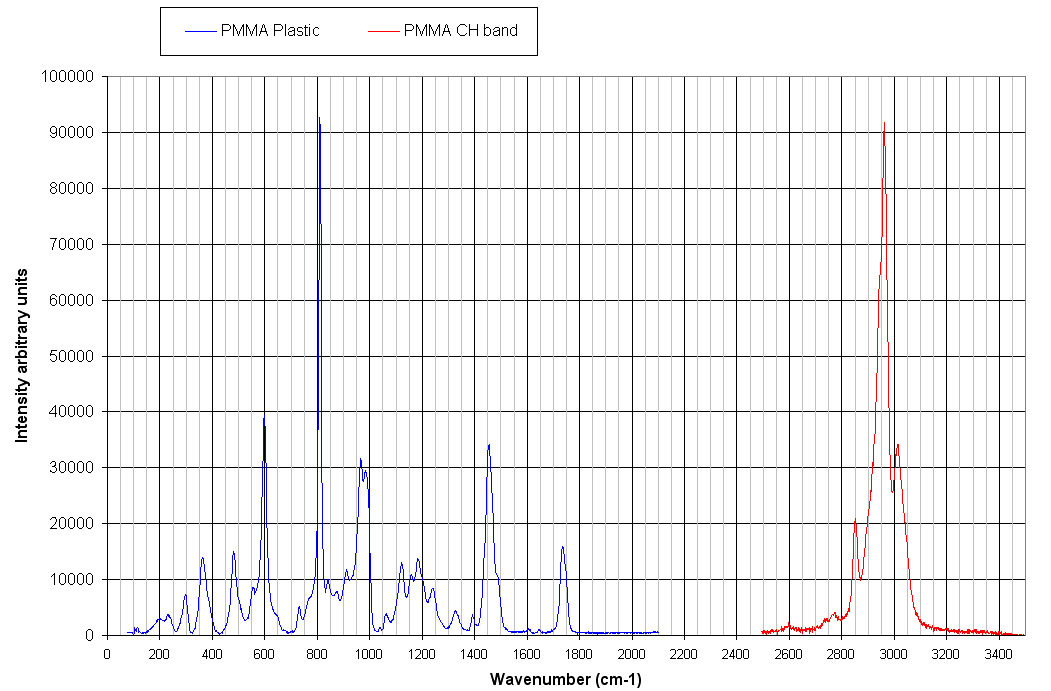
Polymethyl methacrylate (PMMA - plexiglas). This spectrum from a clear plastic disk used for the presentation of minerals samples in display cabinets is identified as PMMA. It illustrates again the better performances of the new spectrograph compared to the H-20 which was unable to record spectra from 200 to 1800 cm-1. Here we can see the vibration of the ester C=O bond at 1730 cm-1.
|
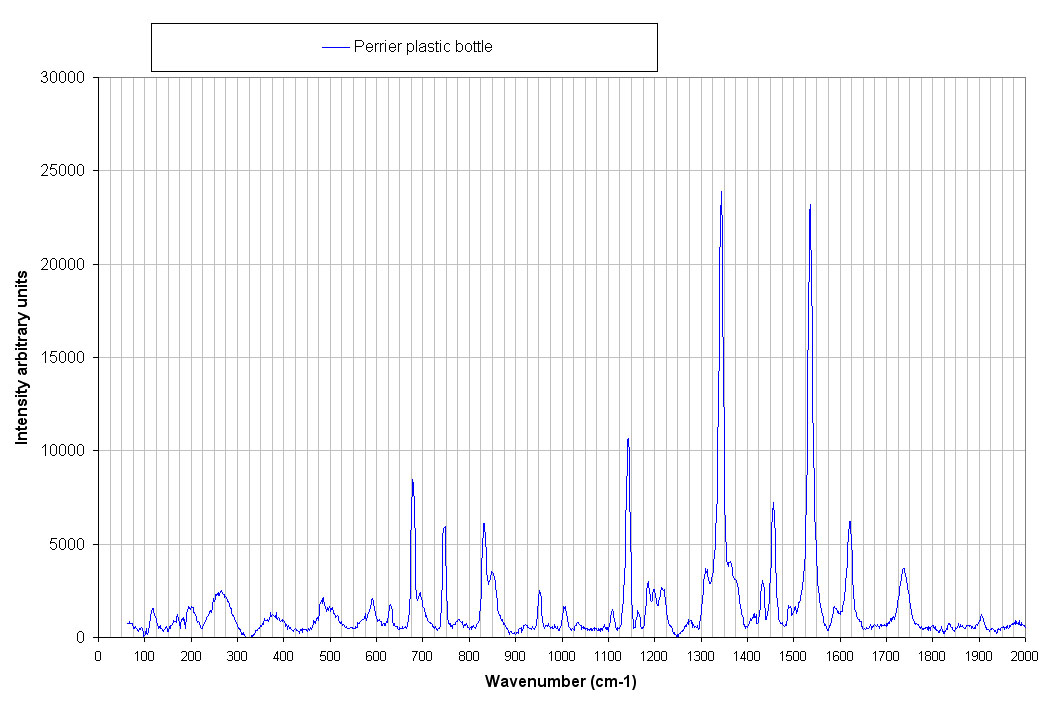
Raman Perrier Plastic Bottle
Spectrum of a green plastic Perrier bottle of mineral water. I have'nt tried yet to identify this polymer.
|
