Raman Spectra of Metamorphic Rocks Minerals
| Garnets | |
 |
|
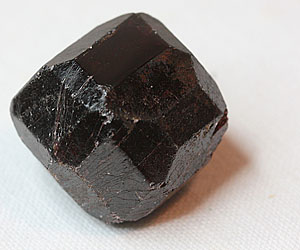 |
Spectrum of the rectangular face at the apex of the Alamandine crystal shown on the left side. The Raman spectrum has peaks similar to the reference spectrum. |
 |
|
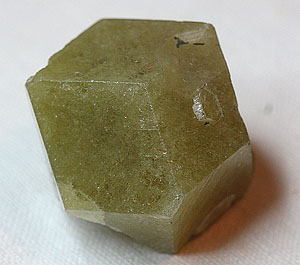 |
Raman spectrum of the Grossular crystal seen on the left. Again the spectrum obtained is quite similar to reference. The Raman spectroscopy can distinguish the two kinds of Garnet structures. Note that the fluorescence background of the clear Grossular is much higher than the dark Almandine. In general, I have obtained lower fluorescence spectra for deeply colored minerals. Some transparent clear crystals give only but fluorescence without any Raman lines. |
| Micas | |
 |
|
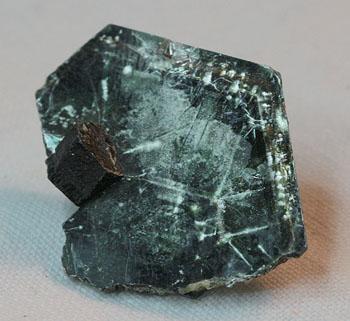 |
I have used the mica sheet shown on the left to record the spectrum above which can be immediately compared with the reference. |
| Andalusite | |
 |
|
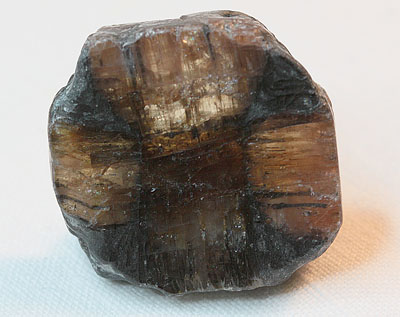 |
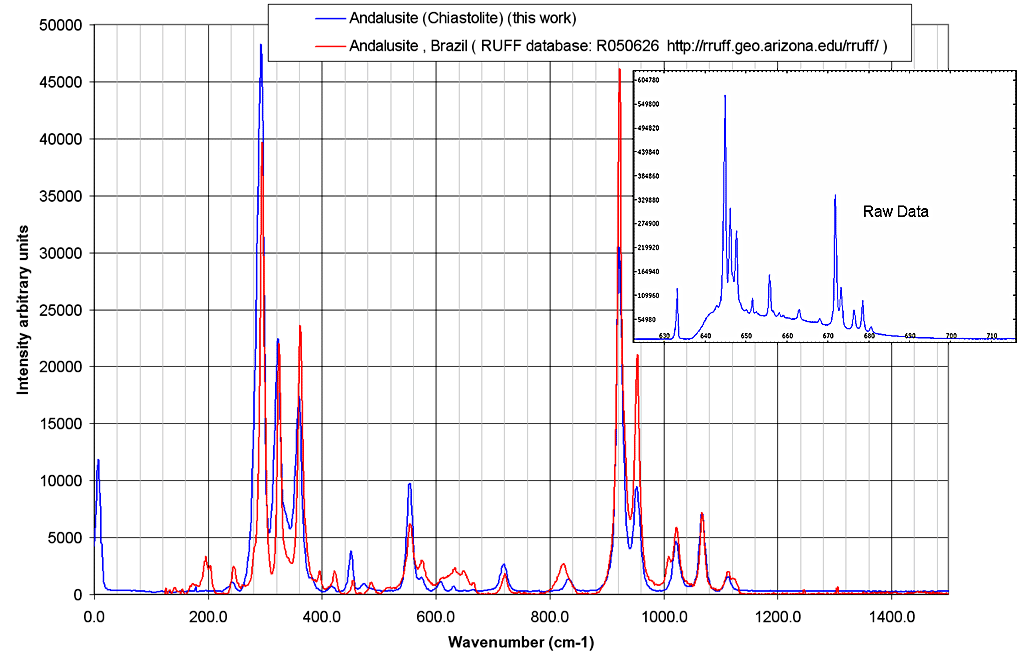
The Raman spectrum of the clear part of this Chiastolite sample is characteristic of the mineral Andalusite as shown in the figure above. Andalusite has low fluorescence intensity and so a high signal to noise Raman spectrum. |
| Cordierite | |
 |
|
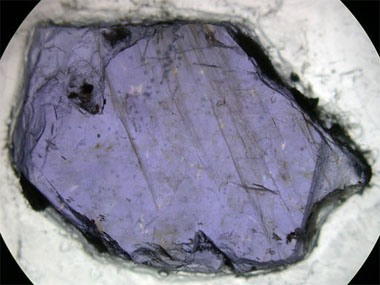 |
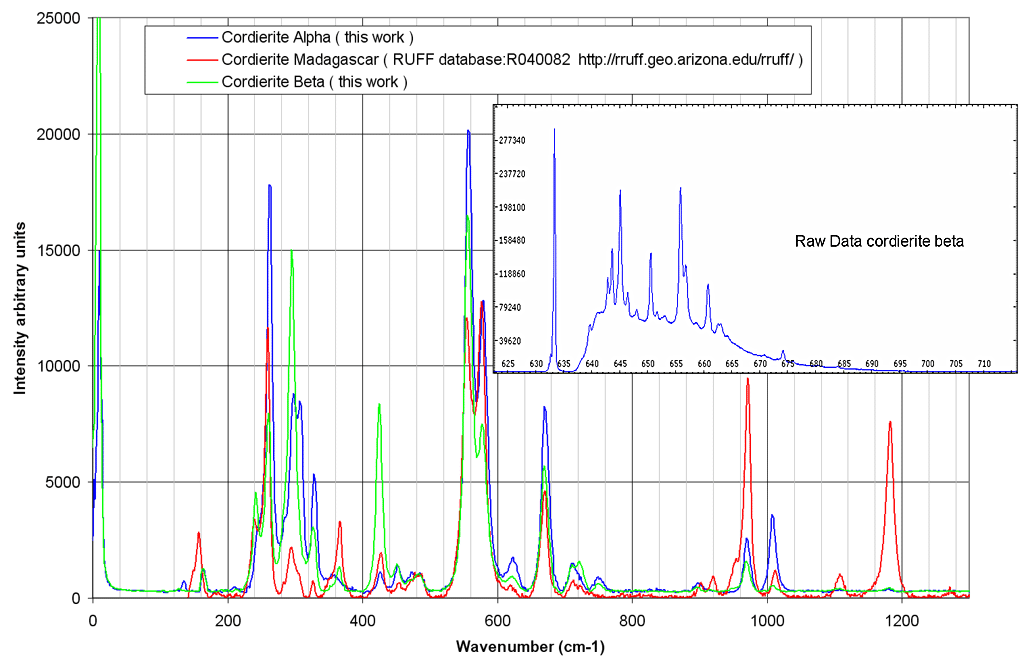
Two cordierite spectra have been measured on the crystal on the left at
an angle of 90° from each other. Again we can notice the high influence
of crystal orientation. The peaks above 1100 cm-1 are
absent from our spectra due to the high vignetting of our spectrograph.
See also absorption spectra of this sample. |
 |
|
|
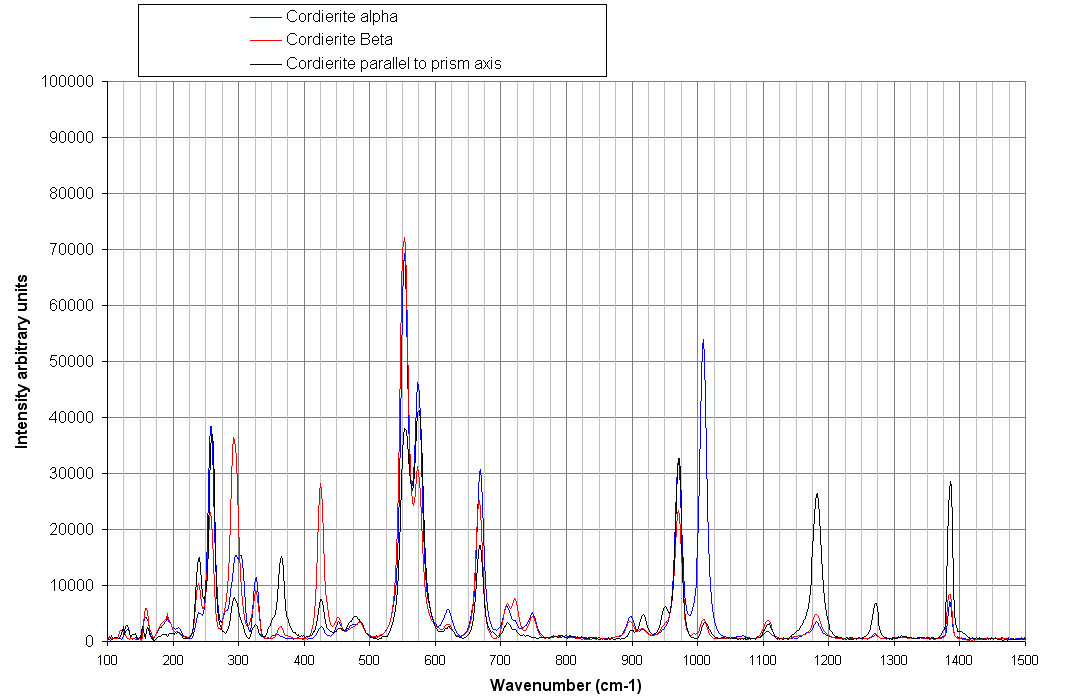
Complete Cordierite Raman spectra for 3 crystals orientations recorded
with the new spectrograph. The frequency range is extended due to a
better optics.
|
|
 |
|
|
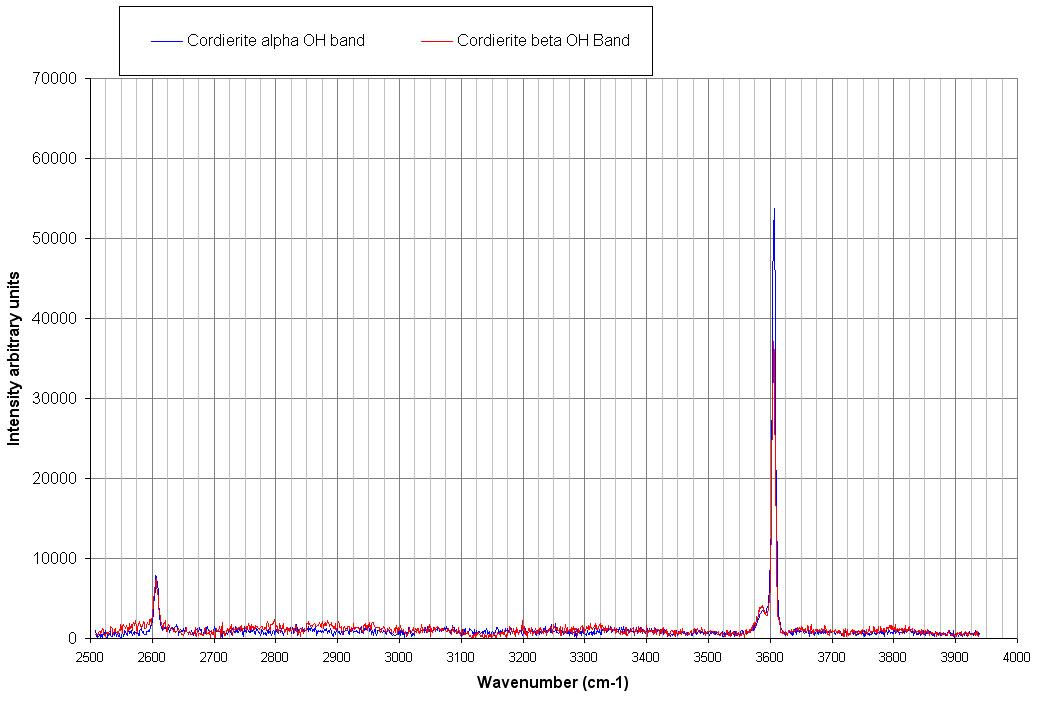
Water can be present in the Cordierite as shown in the spectra above in
the OH stretching range.
|
|
| Epidote | |
 |
|
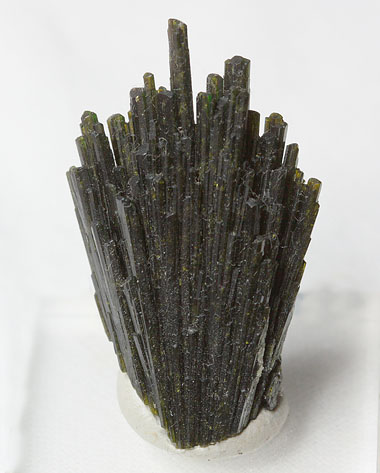 |
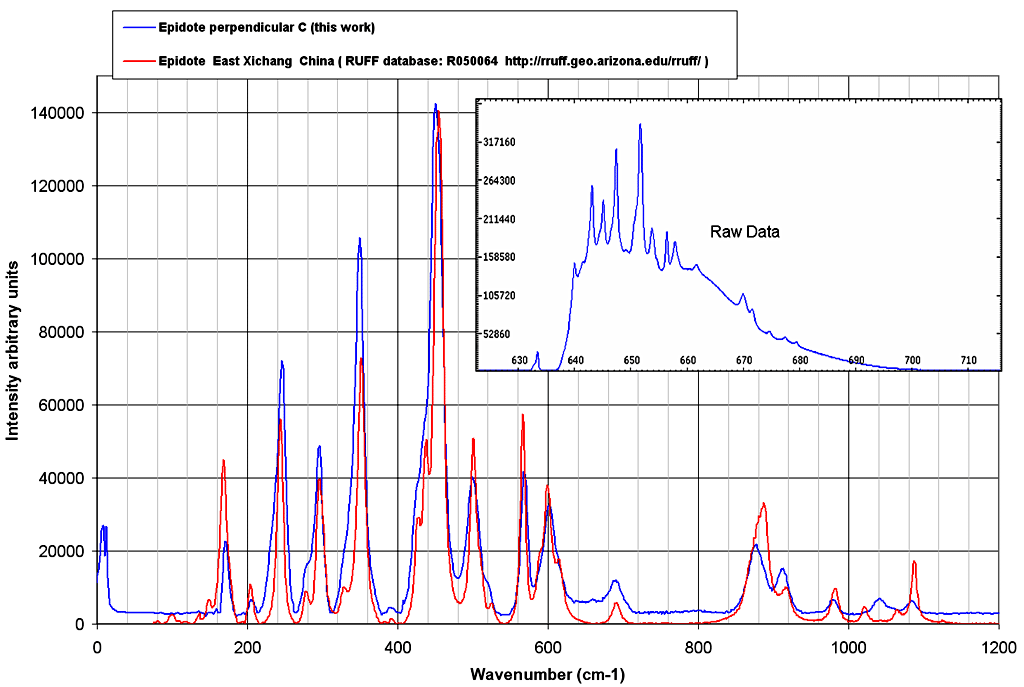
A section has been cut in an Epidote
single crystal. This sample gave the Raman spectrum above. The many
lines of this spectrum can be compared to the reference. Although
similarities between both spectra are evident, the reference has a
better resolution than our spectrum. Absorption spectra of the same crystal section can be seen. |