Hornblende Mica Schist Raman Spectra
| This page and the 3 following ones
illustrate the use of the Raman microscope to
identify some of the minerals of a rock section. The pictures presented were
obtained unless otherwise specified with lateral illumination on a
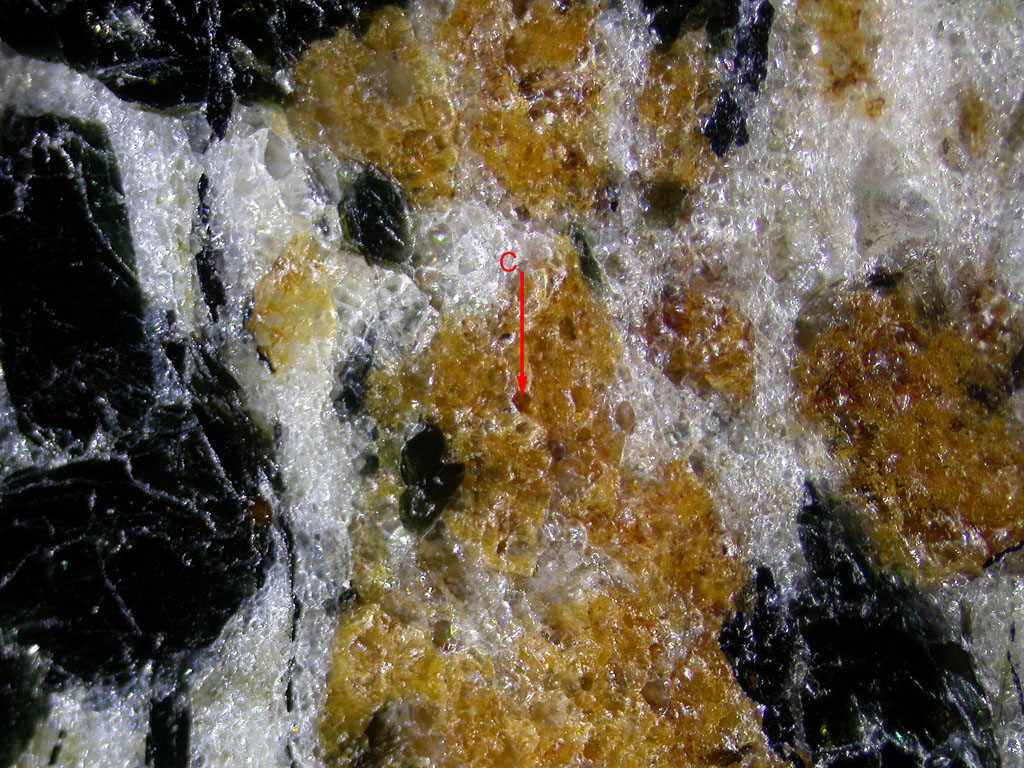
polished slab. As usual, the apex of the red arrow indicates the
position of the laser spot for the Raman spectrum recording. The
comparison between those reflection images and the
thin section can be made
to help the minerals identification. Hornblende |
|
 |
|
| The dark big crystal at the center of this photograph was identified as hornblende on the thin section. | |
 |
|
| The blue curve is the Raman spectrum from spot A, identified as Hornblende, in agreement with the results of the observations on the thin section. The spectrum of spot I will be discussed on page 2. | |
| Muscovite | |
 |
|
| A lot of green transparent crystals are visible throughout this rock section. The Raman spectrum of spot B was recorded and identified as Muscovite. Mica is also clearly visible on the thin section with its high birefringence color. | |
 |
|
| The Raman spectrum of spot B is similar to the reference Muscovite spectrum for wave numbers less than 900 cm-1, that is not including the broad peak at 1040 cm-1. If a database search is done with this peak included, no good match is found so this broad peak at 1040 cm-1 is believed to be a fluorescence peak. Note also its presence on the spot H spectrum to be discussed on page 2. Muscovite frequently exhibits some high fluorescence sometimes so intense that the Raman spectrum cannot be seen at all. | |
| Calcite + Quartz | |
 |
|
| The small brownish crystal at spot C was selected for Raman recording. | |
 |
|
| The spot C spectrum has been interpreted as the sum of 2 minerals contributions : Quartz and Calcite as can be seen by comparison with some other Raman spectra recorded on pure single crystals. The brown color cannot be attributed to anything at this step and will be explained later. | |
| Opaque mineral : Ilmenite | |
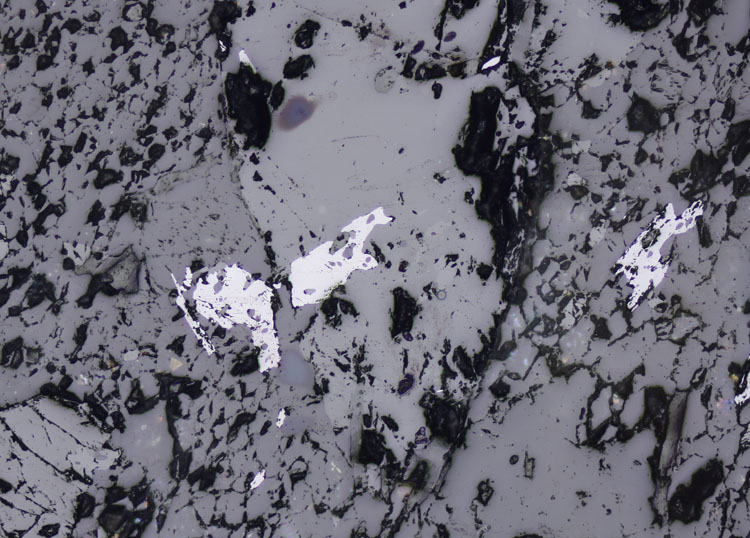 Normal incidence reflection image. Opaque minerals appear white while dark spots are defects in the polishing (holes).
|
 Thin section in non polarized transmission light showing opaque minerals as black spots.
|
| Small opaque minerals particles can also be analyzed by the Raman microscope. On the image to the left (normal incidence reflection), the light is directly reflected from an opaque mineral which acts nearly as a mirror so it appears almost white. | |
 Normal incidence reflection view with polarizer and analyzer. On this image taken in normal reflection between crossed polarizers (in fact slightly uncrossed to increase anisotropic effect), the anisotropy from grey to dark brown of this opaque mineral can be seen because the two crystals have different orientations.
|
|
 |
|
| The Raman spectrum help to identify this mineral as Ilmenite in agreement with the optical anisotropic behavior and the reflection coefficient estimated qualitatively. | |