Test of an Echelle Spectrograph.
|
Echelle spectrograph coming from an old ICP spectrometer.
|
|
|
|
|
|
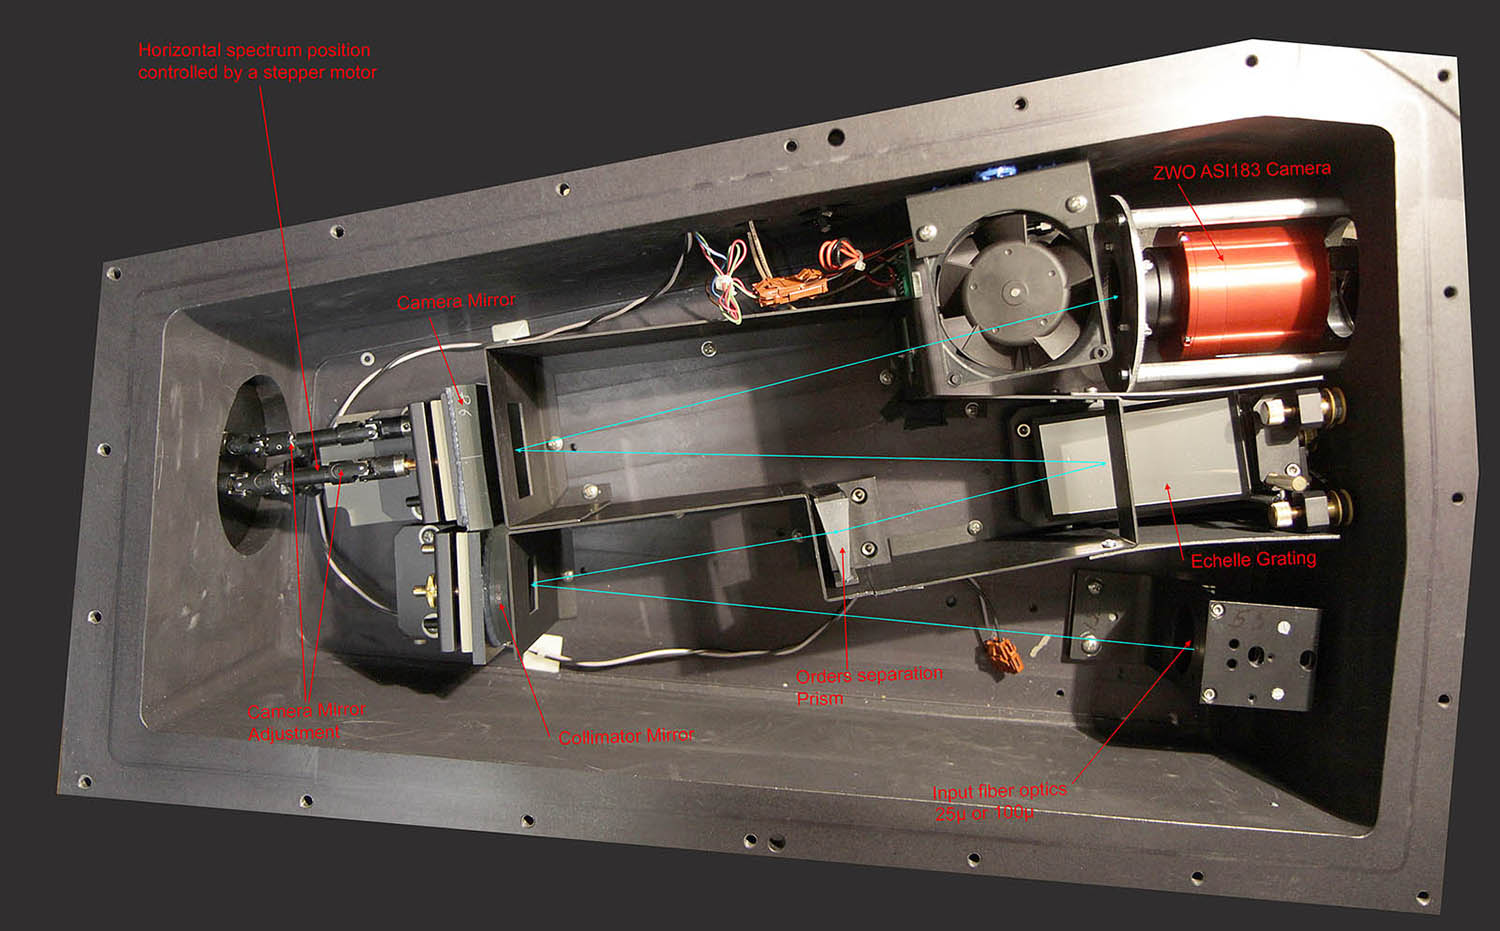
Figure 1: detail of the echelle grating spectrograph. The light is coming inside the spectrograph tank from the low right part of the figure. Originally, the light was focused onto a 25 µ aperture disk by a lens. This 25µ circular hole played the role of the entrance slit of the spectrograph. I have replaced this 25µ disk by a fiber optics with its apex exactly positioned at the 25 µ hole place. The end of the fiber is now the entrance of the spectrograph. This was done to increase the flexibility of the instrument and to allow the replacement of the fiber by a larger diameter one to magnify the light intensity at the expense of the resolution of course. The light, coming from the input fiber reaches a first concave mirror, the collimator, to transform the diverging beam to a parallel light beam. The light on passing trough a CaF2 prism is dispersed horizontally (in the plane of the figure). This prism is the orders cross disperser. The light reaches then the echelle grating which disperses the beam vertically (perpendicularly to the figure). The beam thus dispersed is reflected back towards the camera mirror which focuses the image of the spectrum onto the camera sensor. The original camera has been replaced by an astronomical ZWO ASI183 camera. This has been done because the original UV-visible CCD has part of its electronics inside the camera but is also controlled by the old instrument electronics. I had found no way to use this camera. On the contrary, the ZWO camera is easy to use but its spectral range is limited to 360-950 nm domain.
|
|
|
|
Figure 2: echelle spectrum schematics. The size of the ZWO camera sensor is to small to cover the entire echelle spectrum. This was also the case of the original camera. So only part of the spectrum mainly in the visible region is accessible to the camera. This is illustrated by the black rectangle in the figure. To make my tests, I have connected a stepper motor to one of the camera mirror adjustment screw to scan the spectrum horizontally. I can thus make several pictures of the spectrum by moving the mirror between each snapshots. The different parts of the spectrum can be assembled afterwards. Of course a larger sensor should be a much better solution to record a spectrum in one shot without moving anything in the spectrograph. ZWO has now a full frame camera but it is rather expensive. |
|
|
|
|
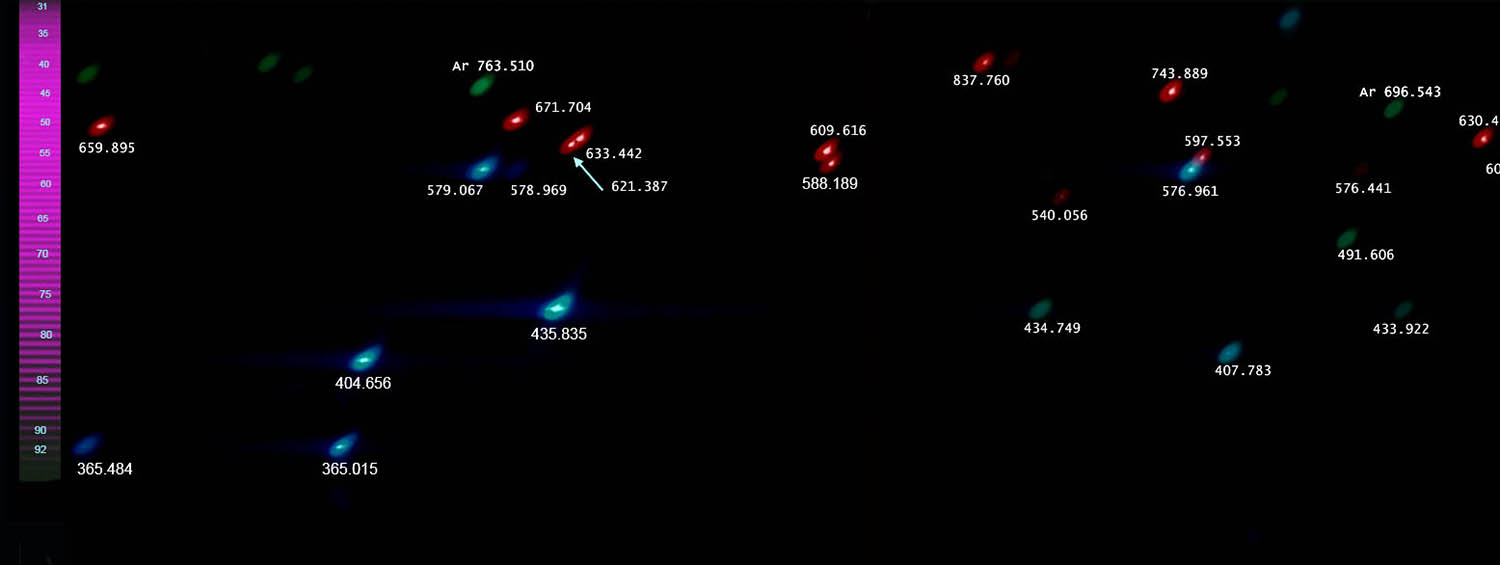
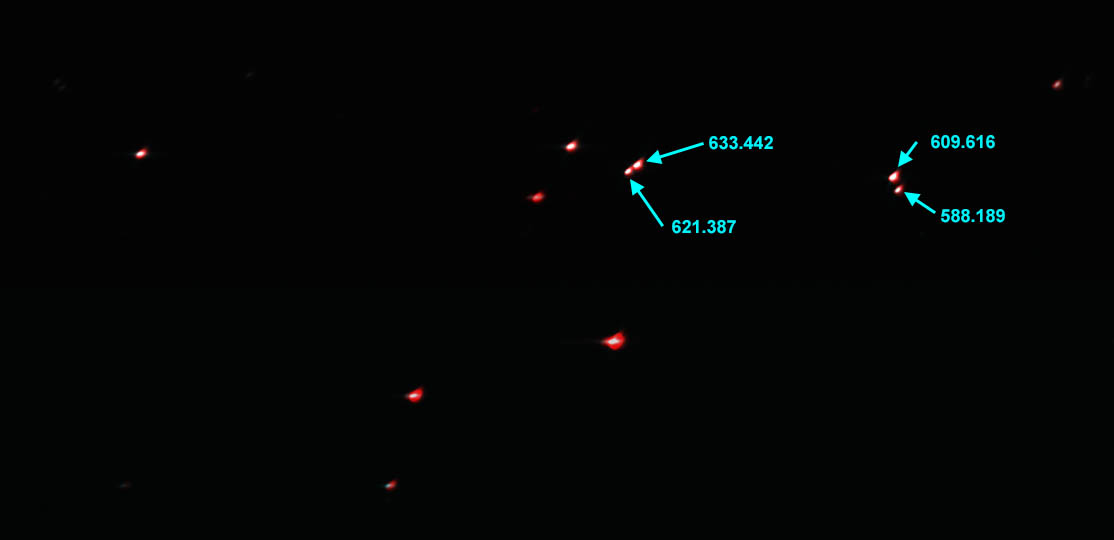
Figure 3: comparison of spectra between 25 µ fiber and 105 µ fiber. This picture is only a part of the full visible spectrum. The red spots are coming from neon light and the blue-green are mercury lines with a 105 µ fiber. The white points inside the red and blue spots are obtained with the 25 µ fiber. The resolution difference is obvious. The numbering orders scale is on the left. The main problem when using a large diameter fiber is not the reduction of the resolution but the orders overlap. Look for instance at the neon 633 nm 621 nm red spot. The two emission lines are well separated with the 25 µ fibers but the two red spots are rather confused. It means that a line emitted at 633 nm can also give some peak at 621 nm, a big gap between these two wavelength. Of course, the light throughput is much better with the 105 µ fiber. Some other drawback as explained below can also be avoided with a larger fiber. An idea was to spread the spectrum vertically with another prism but this changes the direction of the light so the spectrum do not cover anymore the camera mirror.
|
|
|
|
|
|
Figure 4: comparison of spectra between 25 µ fiber and 50 µ fiber. A compromise between resolution and luminosity could be the use of a 50 µ fiber. This is illustrated in the figure where the red spots are the neon-Hg emission lines with the 50 µ fiber and the central white point in each red spot is got with the 25 µ fiber. The 621 and 633 nm lines of neon are no more so much confused, they could be separated if a narrow vertical window is selected to convert the image to a spectrum.
|
|
|
|
|
|
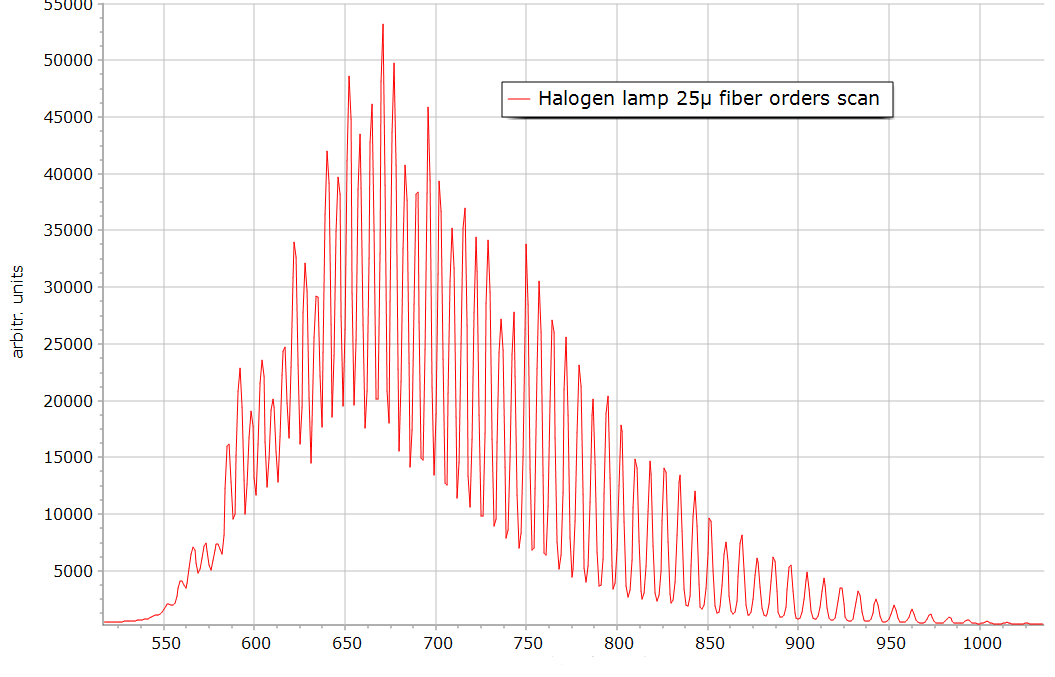
Figure 5: halogen lamp spectrum with a 25 µ fiber. The different orders are well separated. Orders numbers increase from the top of the image to the bottom.
|
|
|
|
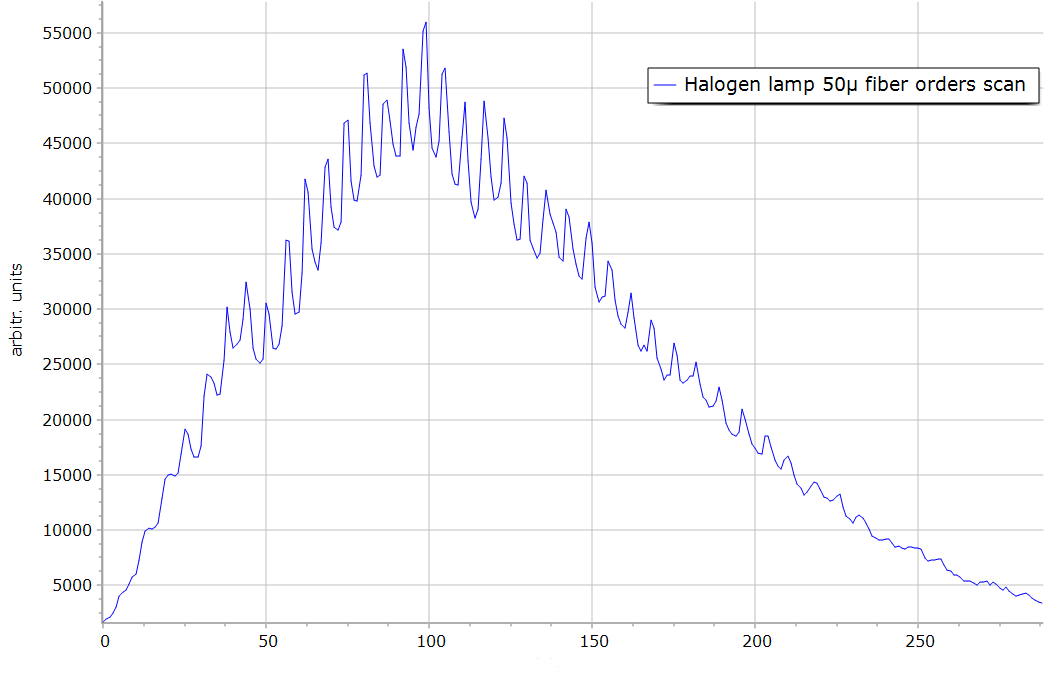
Figure 6: vertical cross section in the picture of figure 5. The graph shows the intensity variation of the different orders of the spectrum with white light illumination.
|
|
|
Figure 7: same diagram with a 50 µ fiber. The order separation is not so efficient as expected. |
|
|
|
|
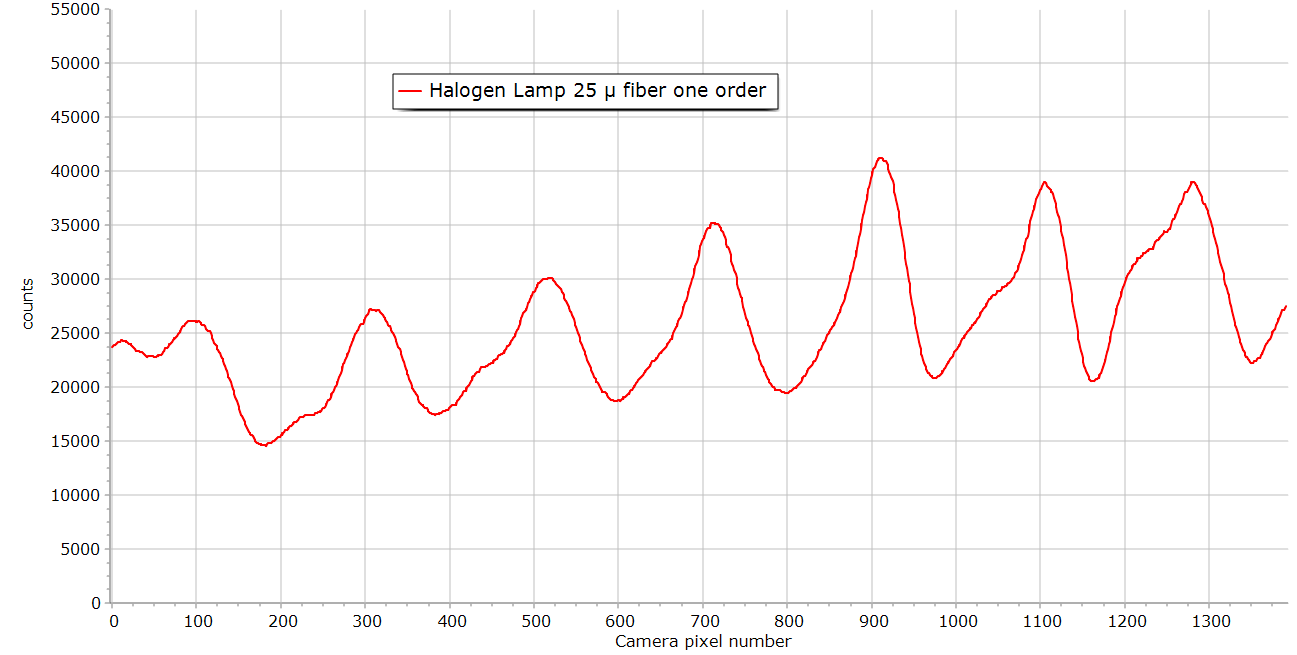
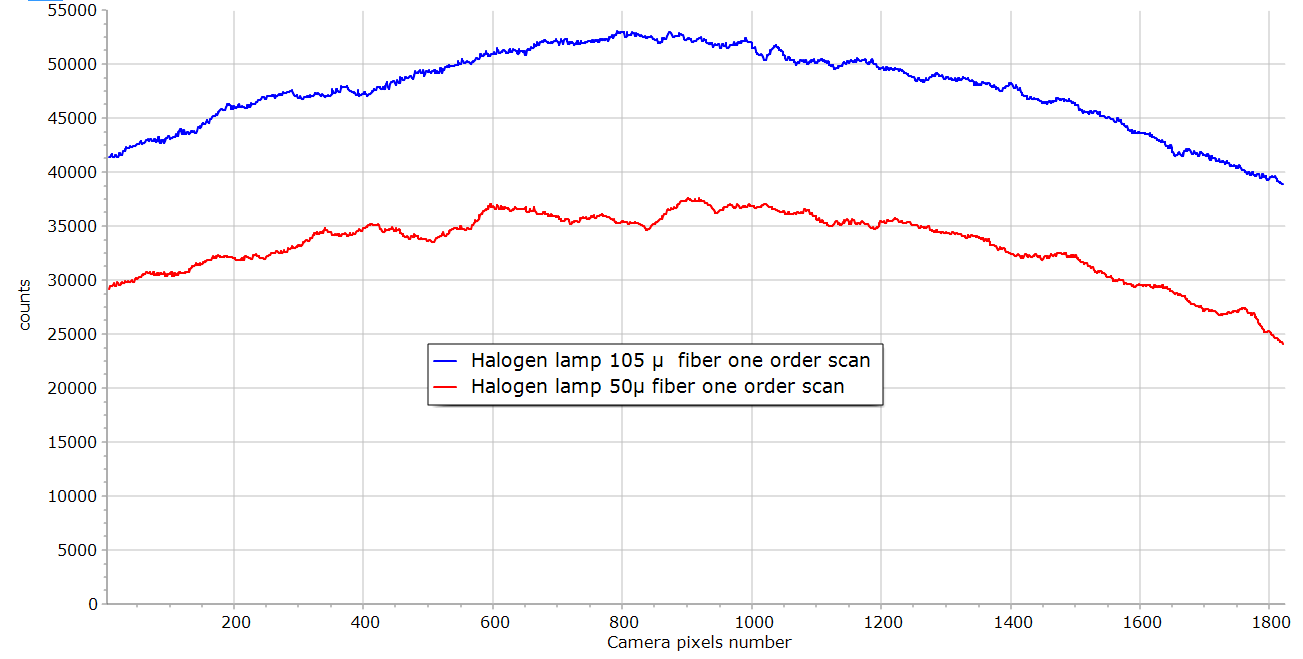
Figure 8: scan of one order in the 2 dimensional spectrum of an halogen lamp. If we examine the spectrum of figure 5, we can see that brighter and darker regions appear in each spectral order. This phenomenon is illustrated on the graph above. A more continuous shape is anticipated for the spectrum of a filament bulb. The oscillatory profile exhibited in the figure is not reproducible, it changes if the direction of the light beam at the fiber entrance is modified. It is believed that this behavior is due to the fiber itself. Probably in such a small fiber diameter, the number of modes transmitted by the fiber changes according to the wavelength. This does not occur if the diameter of the fiber is increased as can be seen on the graph below. This is a limitation in the use of small diameter fiber for high resolution spectroscopy.
|
|
|
|
|
|
Figure 9: intensity of the halogen lamp spectrum for one order with fibers 50 µ and 105 µ. The profiles for these two fibers do not show the high oscillations seen with the 25 µ fiber. This phenomenon is thus due to the fiber not the spectrograph.
|
|
|
|
|
|
Figure 10: two dimensional solar spectrum recorded with the 25 µ fiber. The picture above is only a part of the spectrum due to the limited size of the camera sensor. A lot of dark lines appear in the spectrum due to light absorption by elements in the solar chromosphere.
|
|
|
|
|
|
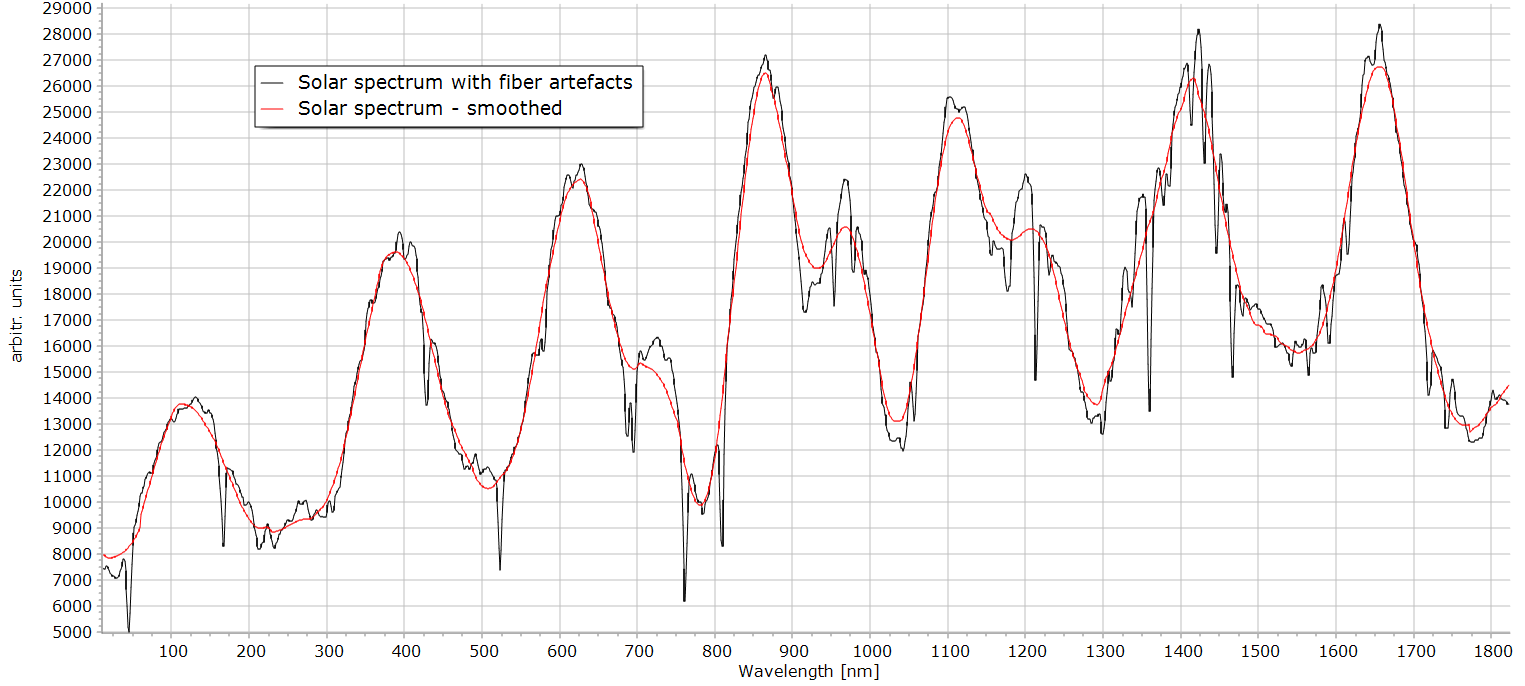
Figure 11: one order scan in the solar spectrum. The oscillatory behavior due to the fiber is still visible. A correction can be made by creating an envelope curve by smoothing the original spectrum. The red curve is an example of such a smoothing. The division of the black curve by the red one could provide an approximate corrected spectrum.
|
|
|
|
|
|
Figure 12: example of a corrected solar spectrum. This small part of the solar spectrum is calibrated with the two neon lines present in this wavelength range. The span of this spectrum is only 6 nm. No attempt has been made now to identify the absorption lines which appear in this spectrum window . |
|
|
Figure 13: Example of a full spectrum: Neon-Mercury-xenon with a 105µ fiber. The motorized camera mirror has been used to record three spectra of neon, mercury and xenon. The red spots are neon, the blue ones mercury and the green xenon. The image is very wide. The wavelength of neon and mercury are annotated on the figure. Some neon lines are present in two different orders, they appear thus twice in the figure. The pink scales represent the order number. (click on the link to see the figure)
|
|
|
Figure 14: Example of a full spectrum: Neon-Mercury-Flame spectra with a 105µ fiber. The flame of a small Proxxon burner has been used to produce these spectra, 4 shots with the moving mirror are necessary to scan the full spectrum. The same neon-mercury lines are used for calibration. A lot of structured molecular bands are present in the flame spectrum.
|
|
