Test of the green laser Raman and comparison with helium-neon.
| Is it useful to build a Raman microscope with two different wavelengths as close as 532nm and 632.8 nm (He-Ne)? The raw spectrum below on a pyroxenite section is a straightforward illustration of the advantage of this dual laser configuration. The integration time of the 633 nm spectrum has been reduced to avoid clipping of the signal. The Raman spectrum at 633 nm consists of small Raman peaks on a huge fluorescence signal. In the 532 nm spectrum, the fluorescence is moderate so that the signal to noise ratio of the baseline corrected Raman spectrum is much higher. Note that the two spectra have neither the same wavelength scale nor the same peak positions. The spectrum wavelength width is larger for the red laser and thus the resolution is better although not visible in the figure below. |
|
|
|
|
| Spessartine raw spectra. The Raman spectrum is very clear and well resolved with the green laser. With the red light, only the manganese fluorescence spectrum is visible, the Raman spectrum is obscured by the high intensity fluorescence signal. To get the red spectrum at the same scale as the green one, the integration time at 633 nm has been reduced by a factor greater than 100. Here the green laser has advantage. |
|
|
|
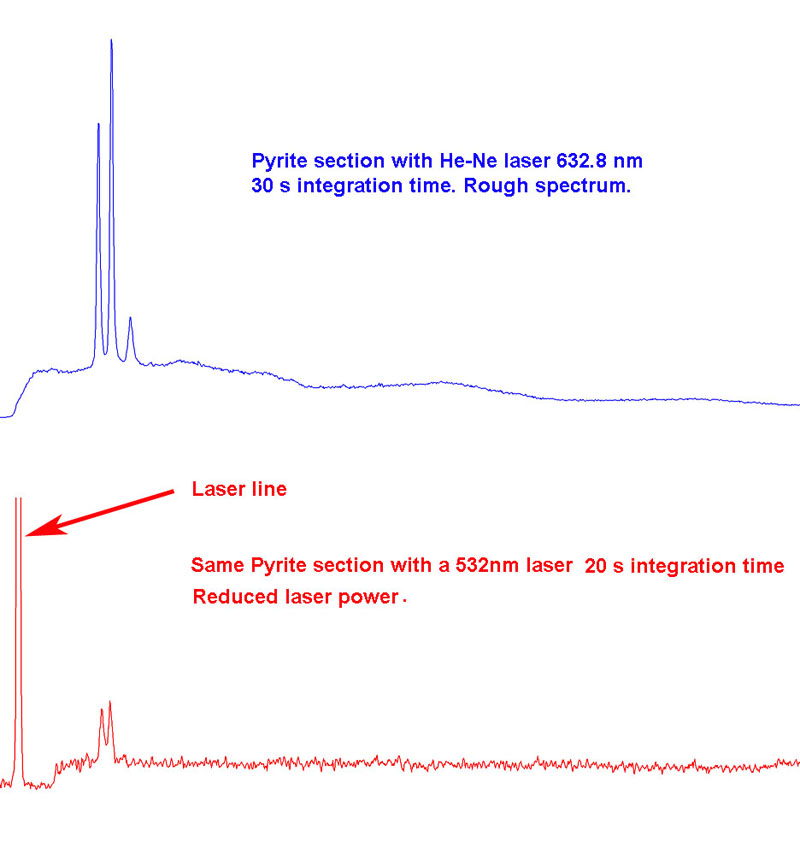
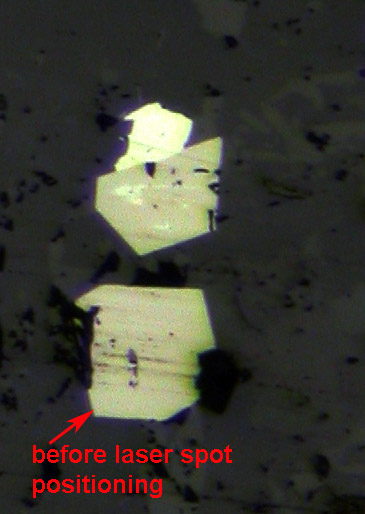
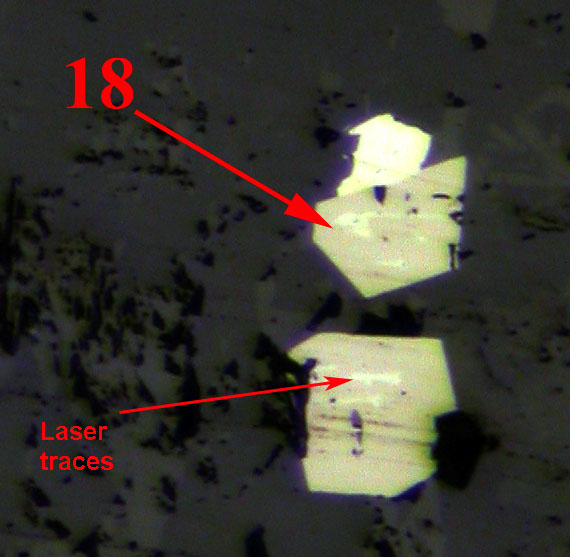
Pyrite polished section. Here is a counter example where He-Ne laser has an advantage. I had to reduce the intensity of the green laser to get a spectrum otherwise the sample surface is burned by the laser (oxidation due to high local temperature?) and no spectrum at all can be seen. This phenomenon has also been experienced with other minerals mainly dark ones. |
|
|
|
Sometimes the spectra at high laser power and low power could be completely different. For example, a magnetite at high power has a hematite like spectrum indicating an oxidation of the surface. As the mineral is completely opaque, the Raman signal should come from a thin material layer where the laser beam is focused. At low power on the other hand, it exhibits a true magnetite spectrum. The two pictures below illustrate the impact of the laser on the magnetite surface. The contrast of the images has been intensified on purpose to show the increase of the reflection coefficient when the laser spot has been passed over some parts of the magnetite surface. This change is very quick and can be observed live in the microscope. |
  |