Raman Spectra of Magmatic Rocks Minerals
| Olivines | |
 |
|
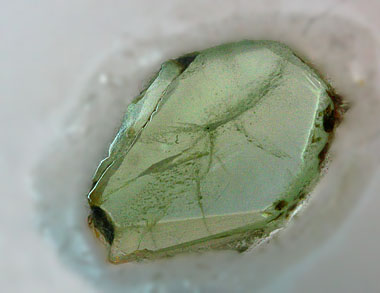 |
Section of a transparent Olivine crystal giving the Raman spectrum above. |
| Pyroxenes | |
 |
|
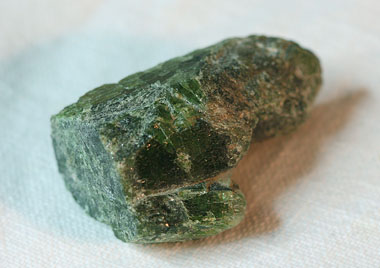 |
The Diopside crystal on the left exhibits a weak Raman spectrum above a huge fluorescence signal. After baseline correction, the spectrum can be compared with the reference. |
 |
|
|
|
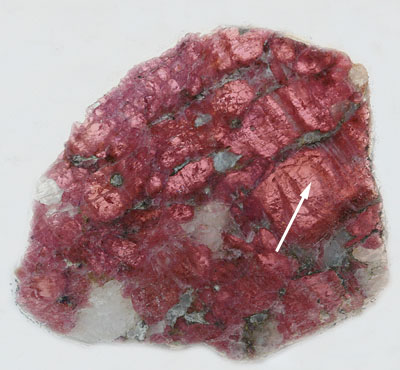
Thick section of a Pyroxenite with the
laser spot for Raman measurement indicated by the arrow. The spectrum
has similarities with the reference Enstatite data although some changes
in some peak positions can be noticed. This could be interpreted by a
different iron composition in both samples. This pyroxenite sample has also been studied previously by the absorption spectroscopy. This absorption spectrum is also characteristic of Otho Pyroxene. |
| Feldspars | |
 |
|
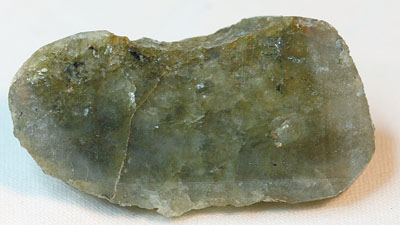 |
Raman spectrum of the Labradorite sample on the left. The fluorescence background is high compared to the Raman signal. This seemed to be common in Feldspars: some other very clear samples gave nothing but fluorescence. Comparison with 2 reference spectra of Feldspars can be seen. |
| Sun Stone | |
 |
|
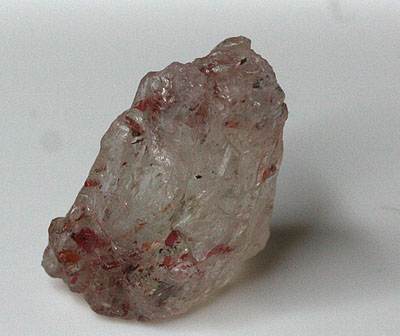 |
Sun stone feldspar measured without any
sample preparation gives the spectrum above. This spectrum has strong
similarities with the Labradorite sample described above. The nice red inclusions have not yet been identified. |
| Microcline | |
 |
|
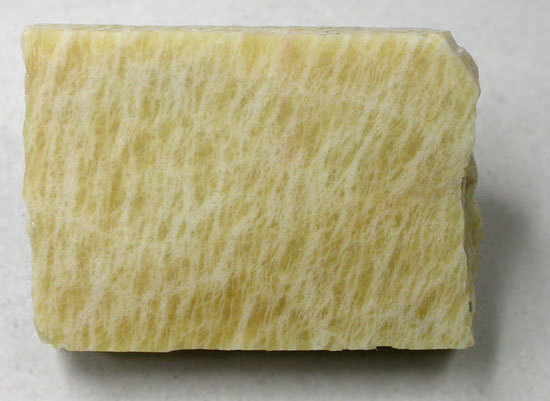 |
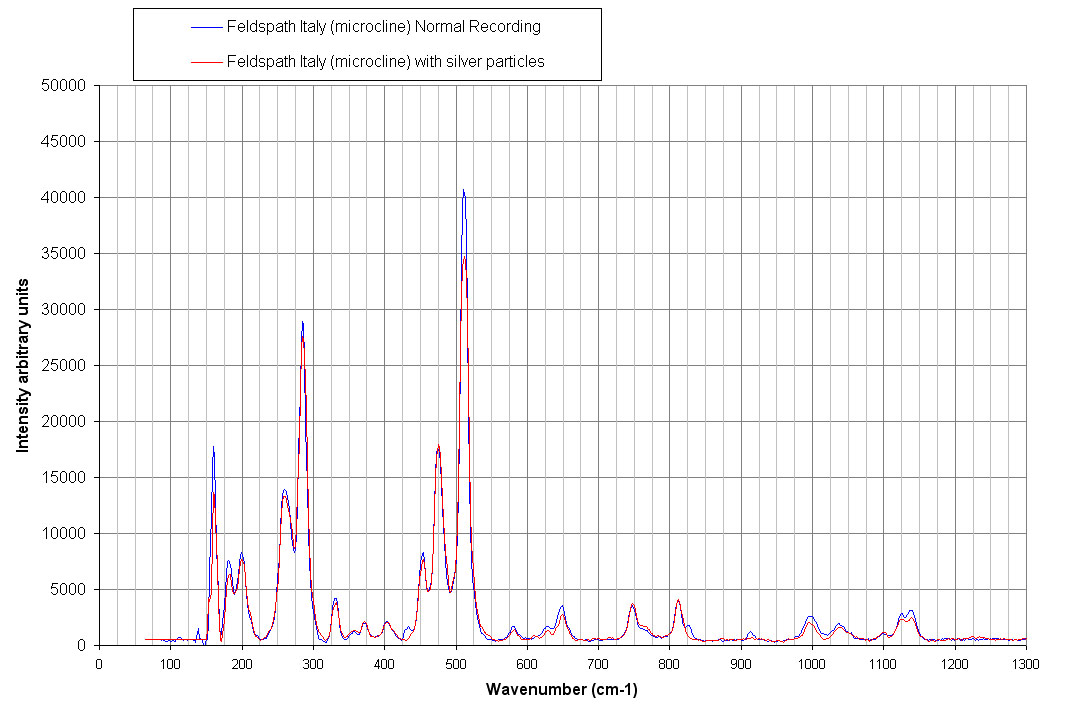
Spectra of microcline from Italy recorded
with the new spectrograph. For one spectrum, colloidal silver particles
have been sprayed on the sample. No enhancement of the signal has been
noticed. Click here for a thin section of microcline.
|
| Quartz | |
 |
|
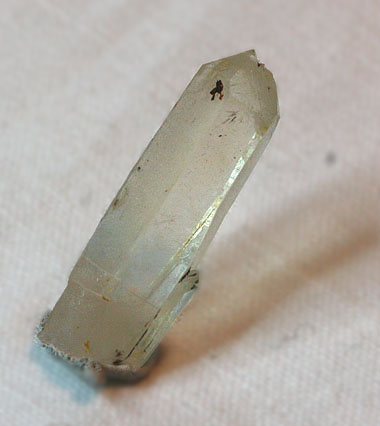 |
Raman spectrum of a polished face of the crystal on the left. The quartz is immediately recognized by the two features at 440 and 200 cm-1. |
| Eudialyte | |
 |
|
 |
Raman spectrum of an Eudialyte thick
section. The multi peaks spectrum has features similar but not identical
to the reference. This Eudialyte section was studied previously with absorption spectroscopy. |
