Gamma Spectroscopy
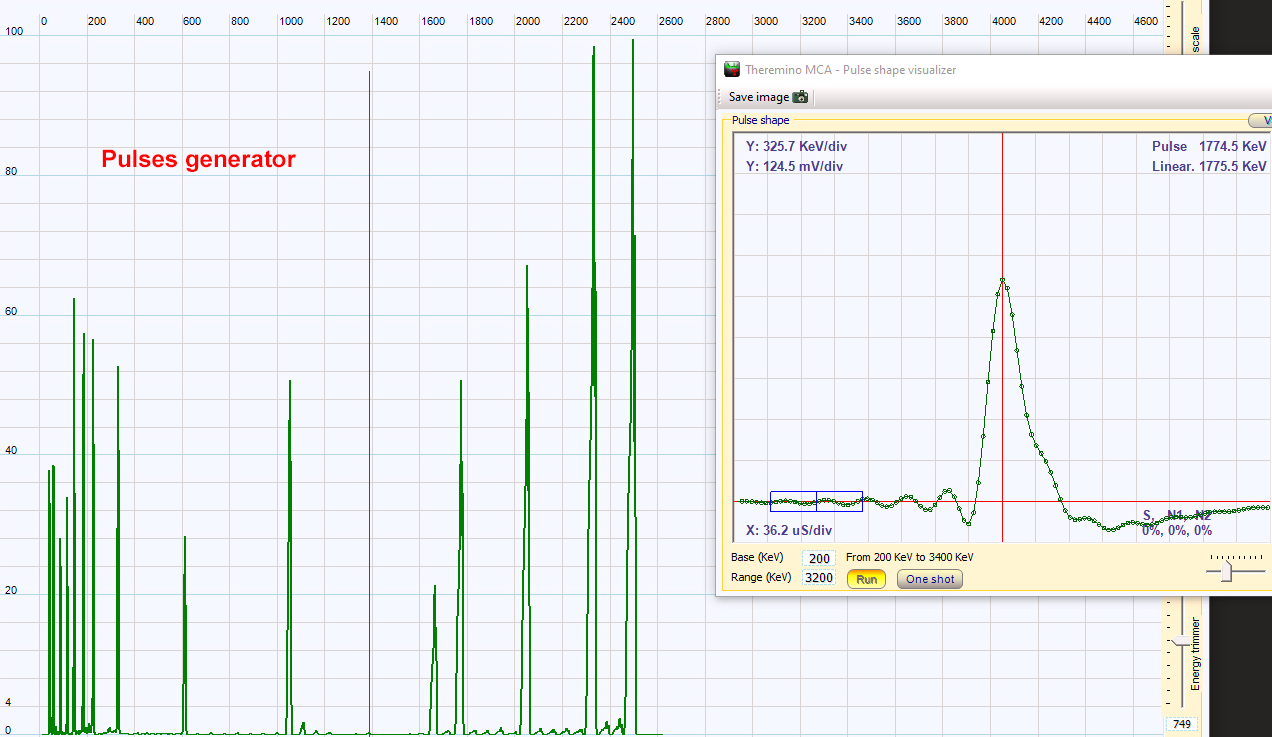 |
| I have used the Theremino multichannel analyzer program with the regular sound card of my PC which has a sampling frequency of 200 kHz. Gamma spectroscopy was not the main goal of the radioactivity page so I did not add any additional filter or sound card modification. The program has been tested first with a pulses generator. The graph above shows on the right the pulse seen by the sound card and the MCA program. The blue rectangle at the left of the peak is the position of the baseline measurement. When the pulses generator send constant intensity pulses to the MCA, one narrow peak is obtained on the MCA graph. If the pulse amplitude are changed quickly, a second peak at another position appears in the graph. The left figure is the result of several step changes of the pulses intensities. It illustrates the best resolution achievable with this software in the present measurement conditions. The upper scale is the pulse voltage (mV). For technical details, see: https://www.theremino.com/en/downloads/radioactivity
|
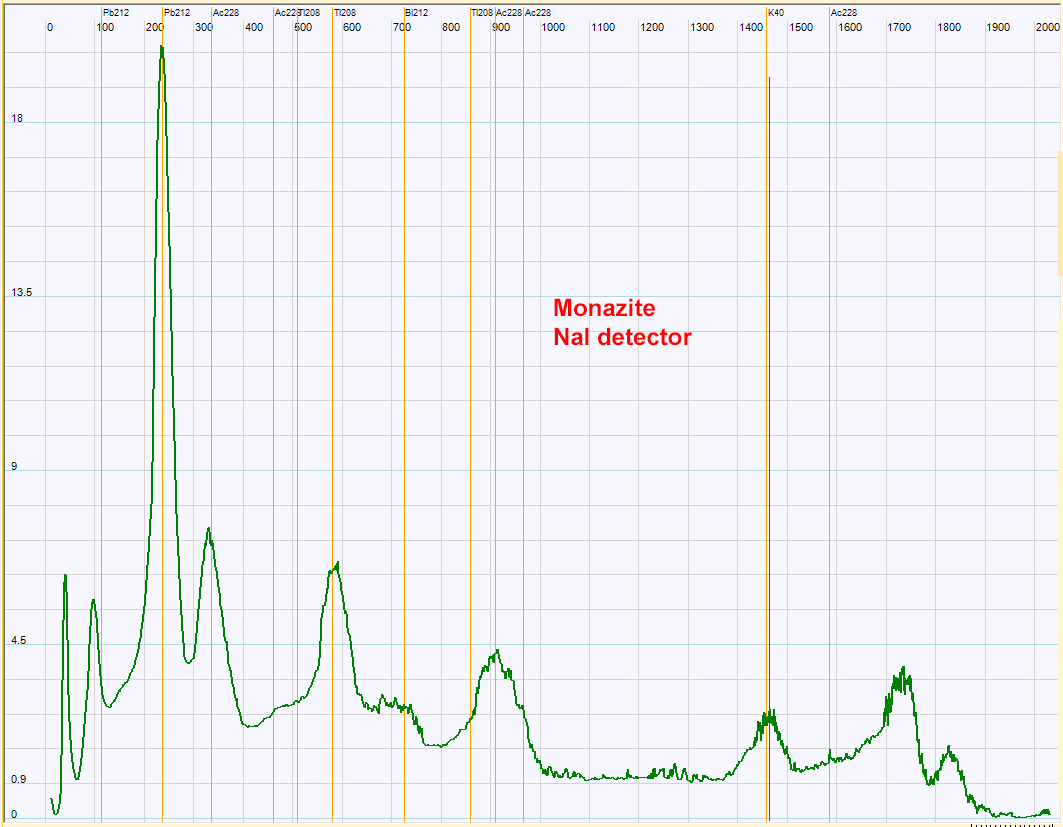 |
| Gamma spectrum obtained with Monazite, NaI detector and Theremino MCA. Some of the daughters of the thorium 232 are recognized. The monazite, a rare earth phosphate, is known to contain some thorium. As I have no standard for the high energy range of the spectrum there is an uncertainty of the position of the peaks at high energy.
|
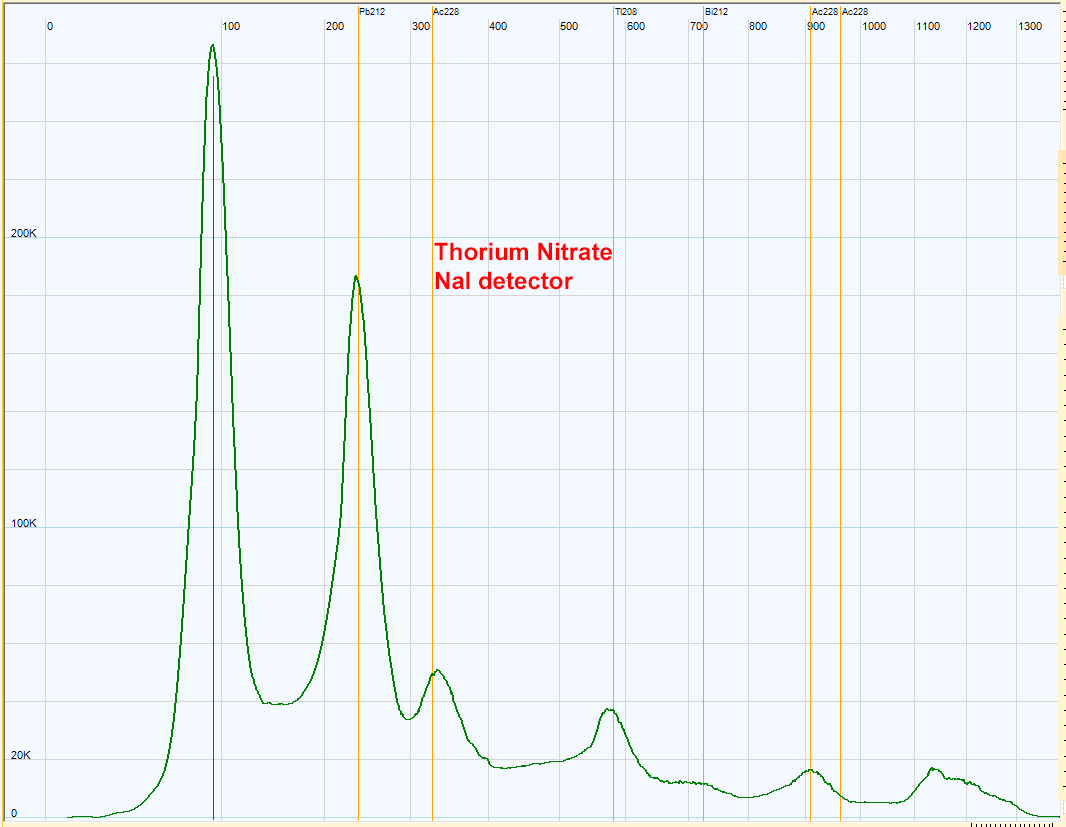 |
| Thorium nitrate spectrum with NaI detector. The same peaks are found in this spectrum compared to the preceding monazite spectrum. Signal to noise is better for the thorium nitrate due to its high activity.
|
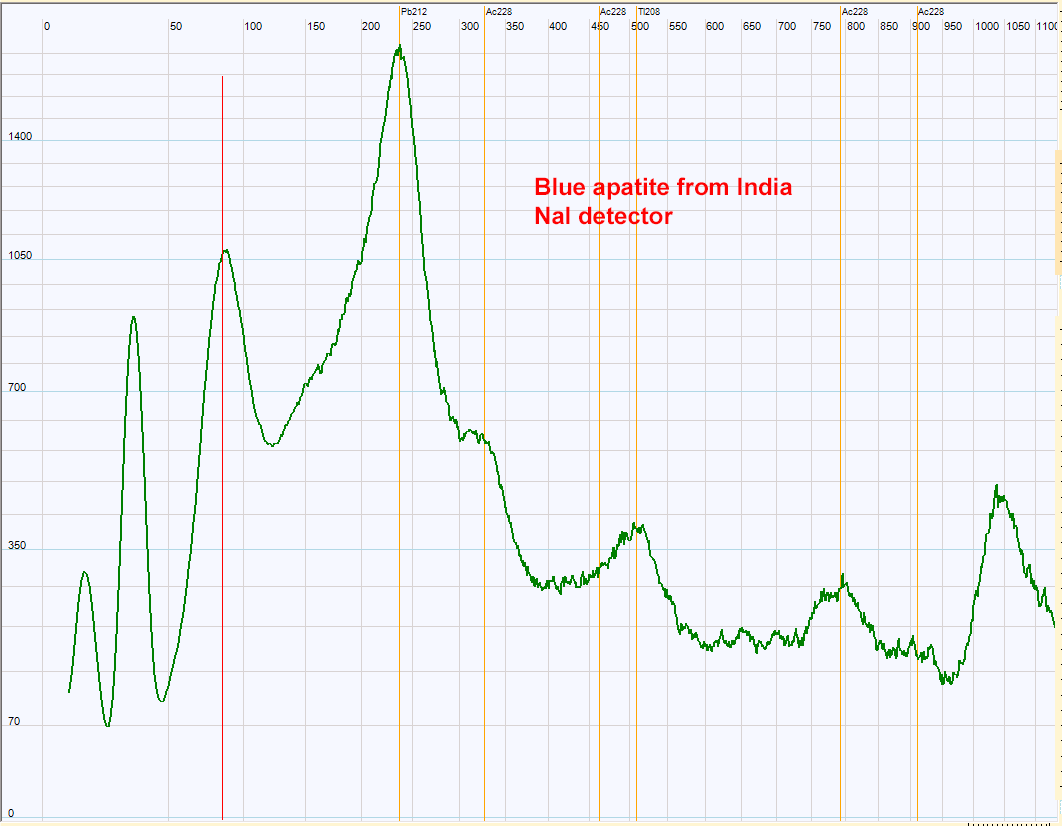 |
| Spectrum of a blue apatite from India. The radioactive contamination of this apatite seems to be thorium.
|
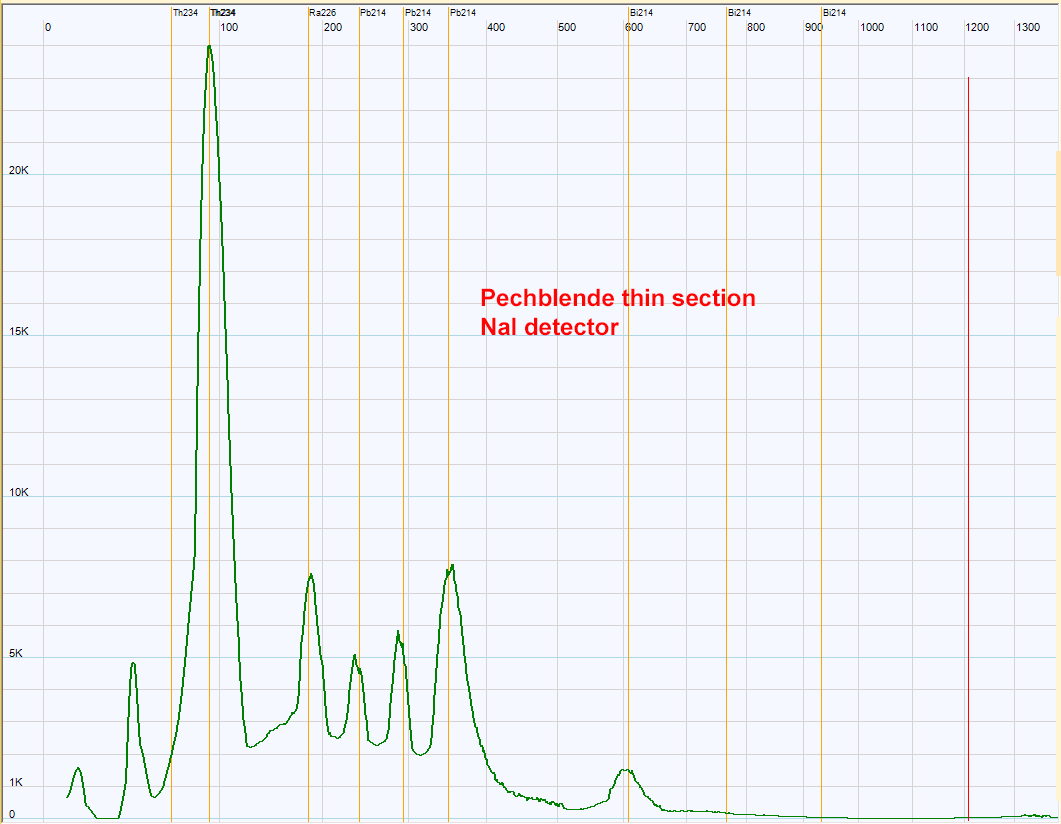 |
| Pechblende from Czechia gamma spectrum with NaI detector. The Uraninite of the pechblende has a so high activity that the MCA analyzer was saturated when a macroscopic sample of around 10g was used. To reduce the count rate, a thin section (100 µ thickness) has been used. The section gives the spectrum above, the 3 peaks of Pb214 are well resolved.
|
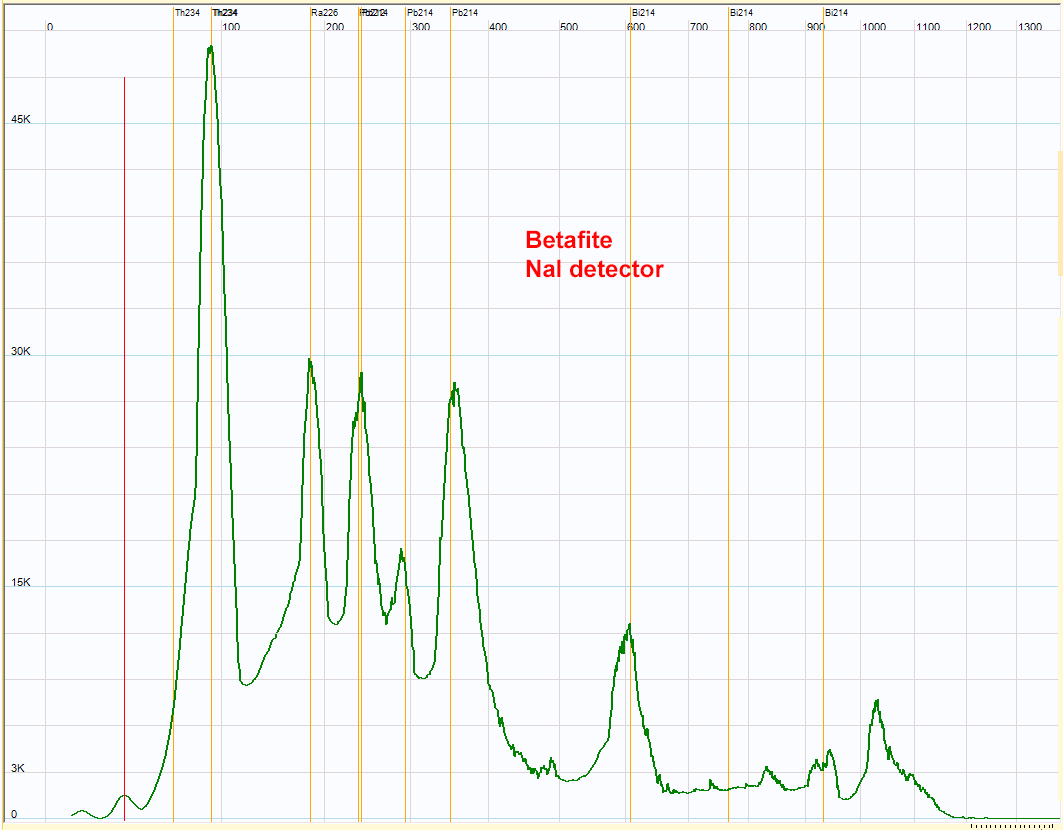 |
| Betafite - (Ca,U,Na)2(Ti,Nb,Ta)2O6(OH)7 - spectrum. The 3 Pb214 peaks confirm the presence of the uranium 238 series. The peak at 230 kev is higher for this rock compared to the pechblende. The Pb212, the main peak of the thorium radioactive series appears at about the same energy. This could indicate the presence of thorium in addition of uranium in this rock. Due to the low resolution of the NaI detector, the Th234 peak could be the sum of the two Th234 gamma rays and some X rays.
|
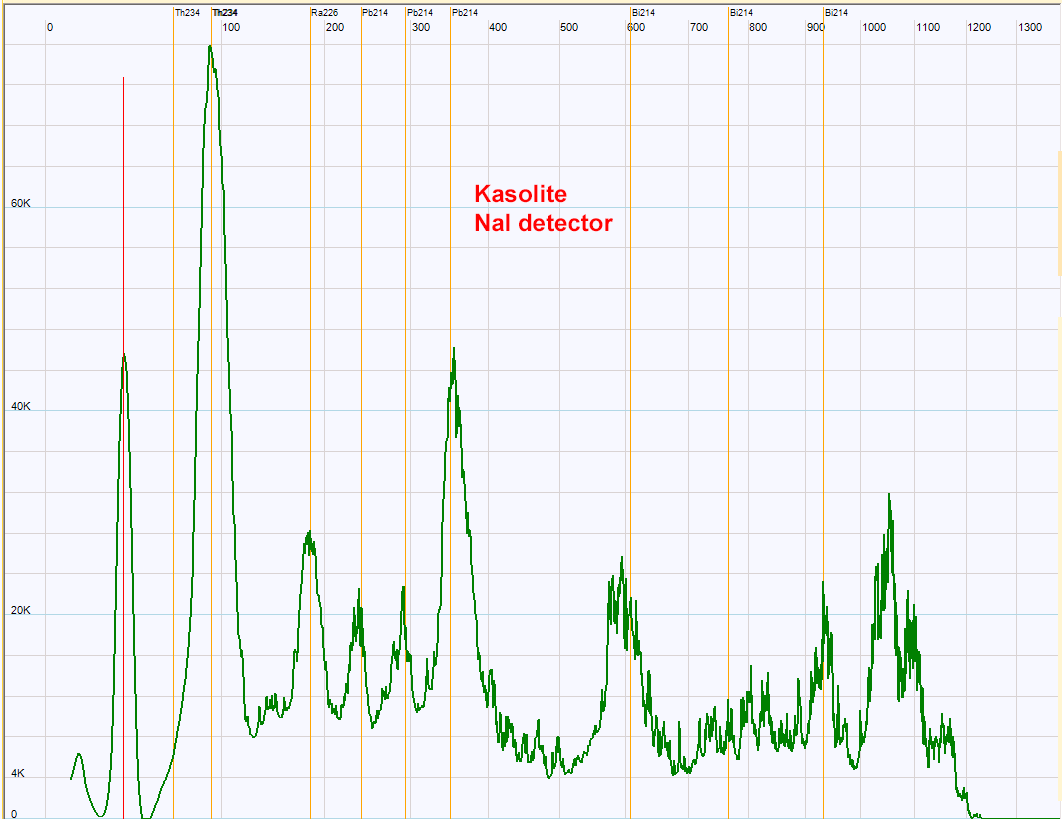 |
| Kasolite-bearing rock - Pb(UO2)SiO4•(H2O) - has a lower activity than the betafite sample so the spectrum above exhibits higher noise. Nevertheless this spectrum indicates the presence of uranium and his daughters Th234, Ra226,Pb214 and Bi214. The peak at high energy has not been identified with certainty.
|
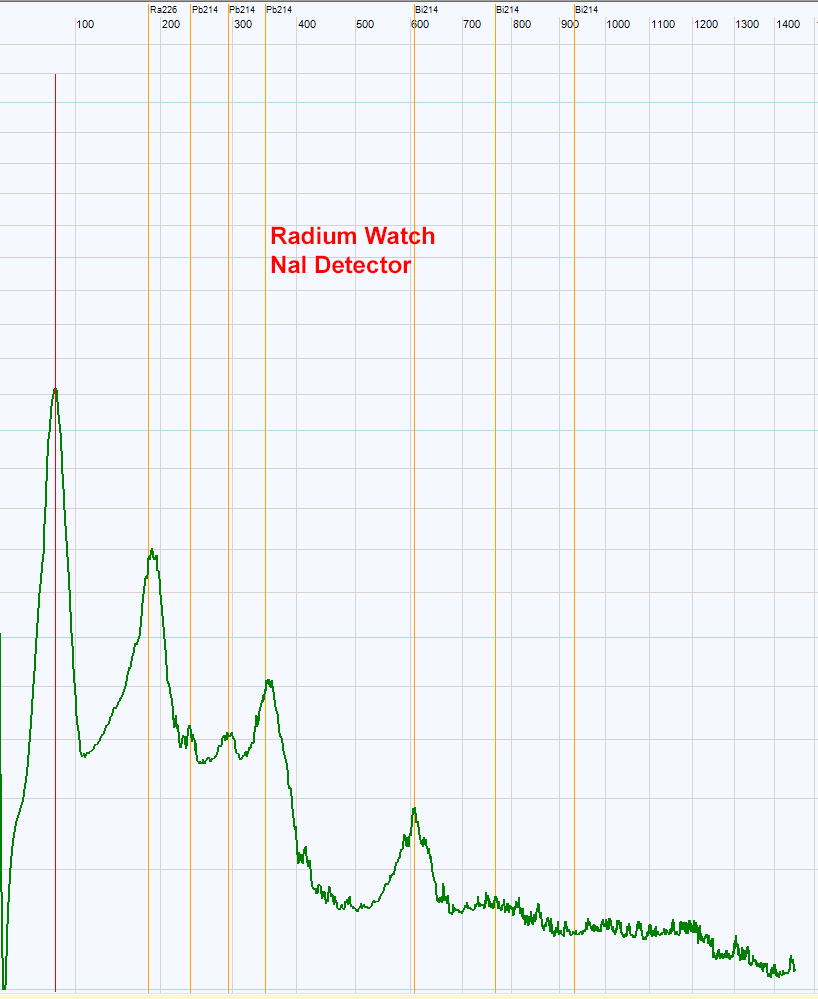 |
| Picture above is the gamma rays spectrum obtained with an old radium watch. The Ra226 peak is higher compared to its daughter Pb214. If the radium is pure, this spectrum could not exhibit the Th234 witch is not a daughter of Ra226. Moreover, as it has been purified in the 20th century, The Pb214 should not have time to be recreated. The same for Bi214. One possible explanation of the spectrum could be the presence of a mixture of Ra226 with some uranium and daughters remaining.
|
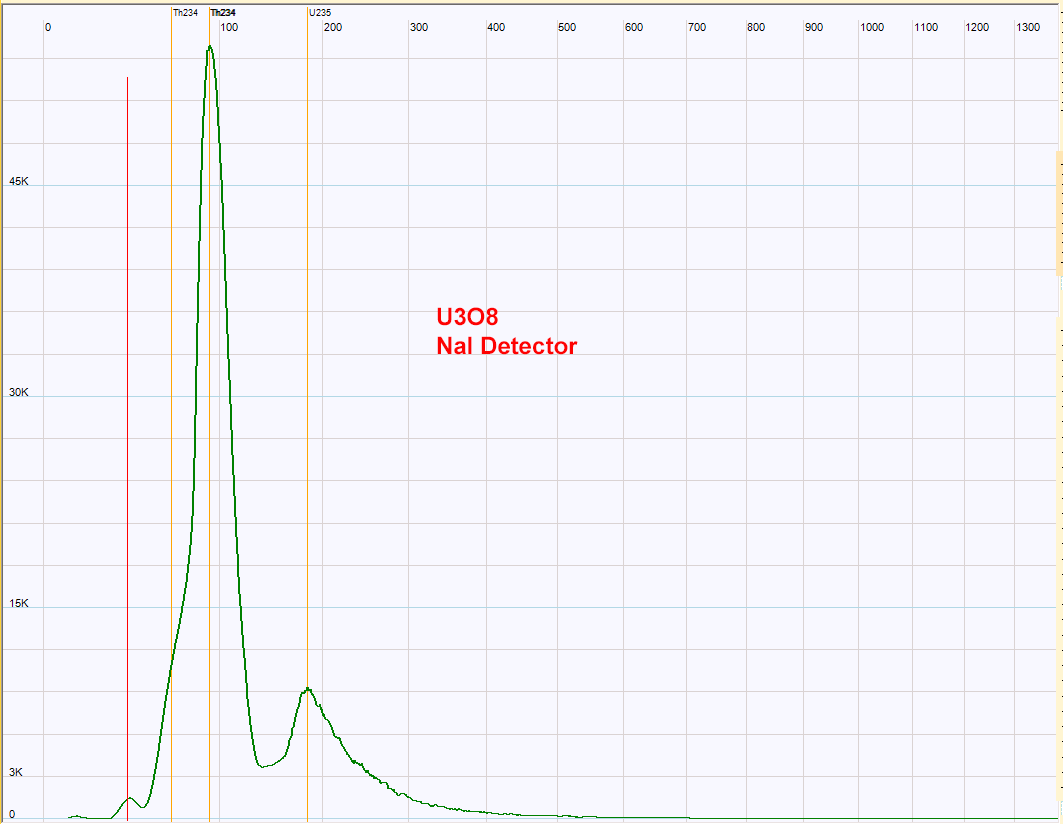 |
| Pure uranium oxide spectrum. The main peak is Th234. The Ra226 should be absent in this powder, so the peak just below 200 Kev could be due to U235.
|
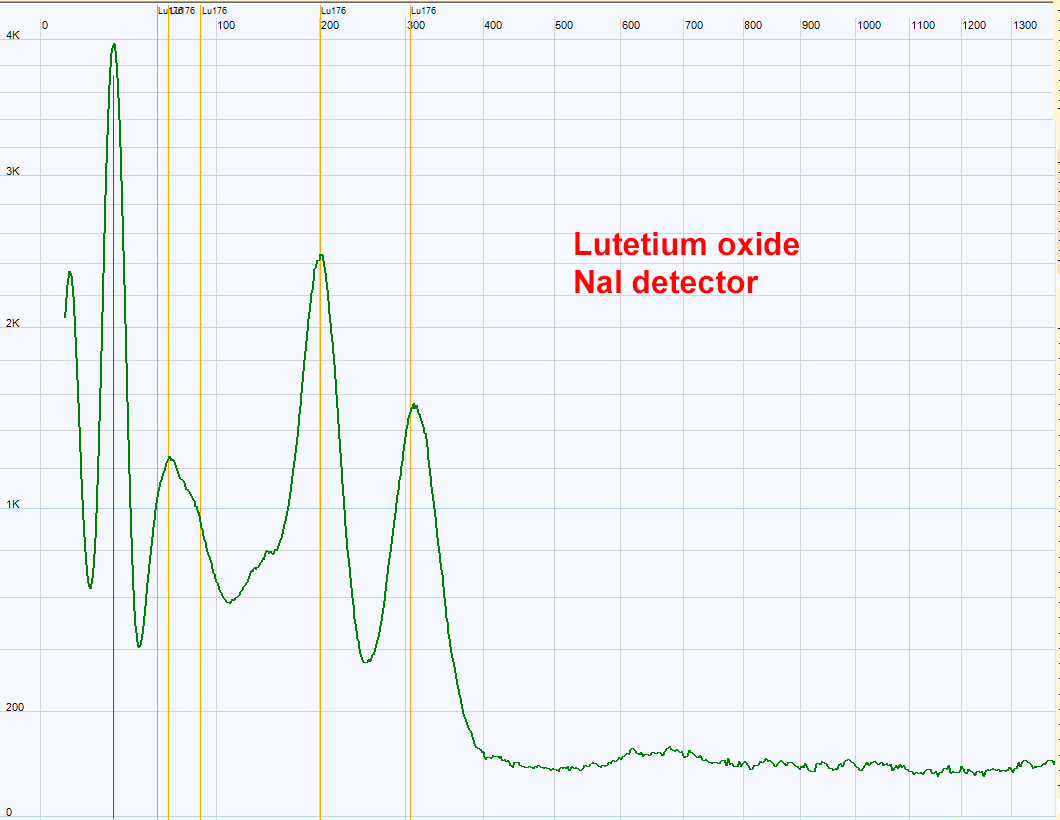 |
| Natural lutetium is slightly radioactive because it contains the 176 isotope which is a beta emitter. The two peaks at 200 and 300 Kev are characteristic of Lu176.
|
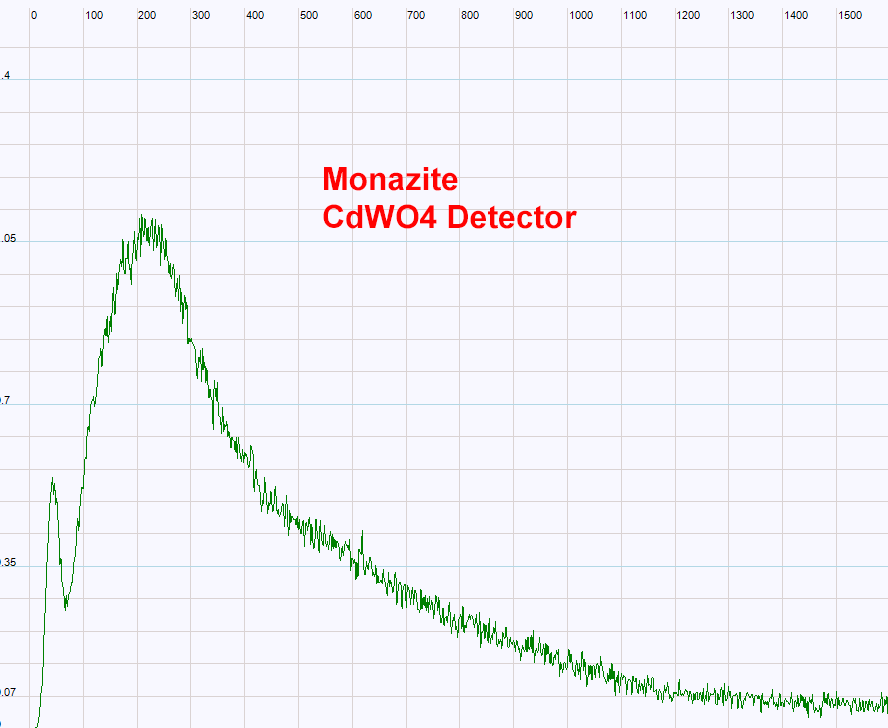 |
| The cadmium tungstate detector has also been used with the MCA analyzer. Up to now no useful spectrum has been recorded with my detector. The reason is still unknown. Probably the small size of the detector and the geometry could be responsible for this lack of photo-peaks in the spectrum.
|
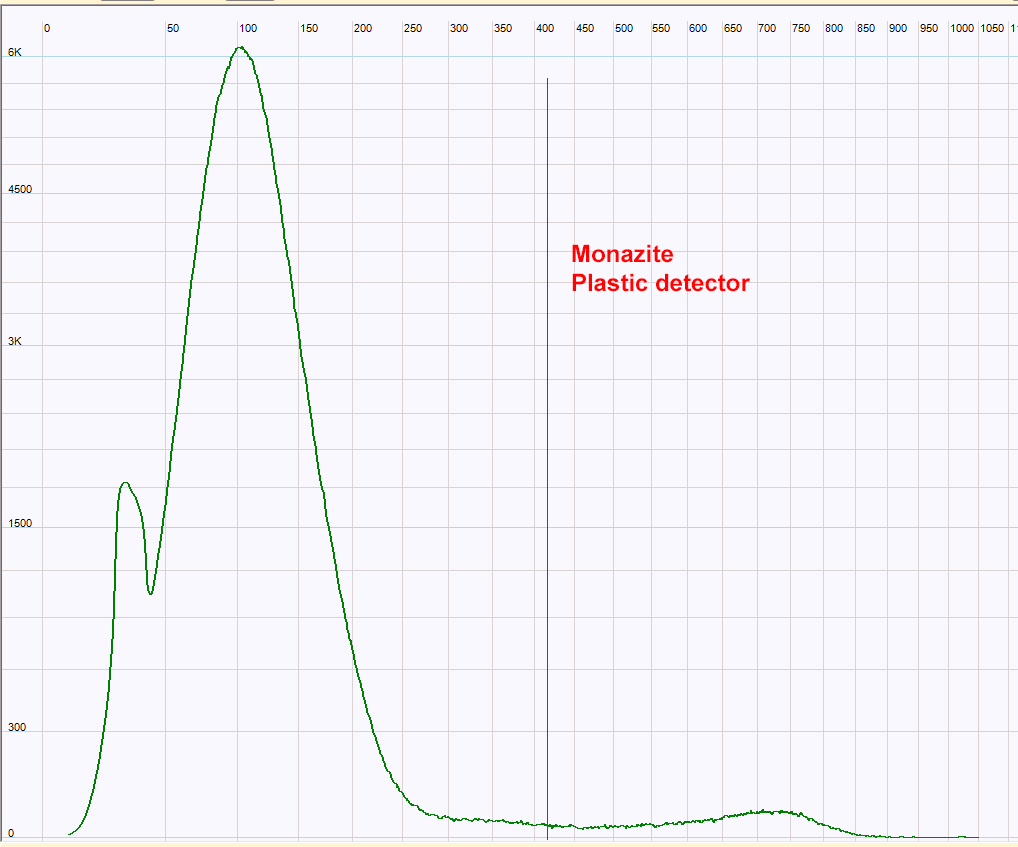 |
| Monazite measured with the plastic detector. This broad spectrum does not allow the identification of the Th232 daughters. It is not surprising because this detector is built only with very low atomic elements so the majority of the gamma rays lose only a part of their energy in the detector so no photo-peak is detected. Note that the energy scale is not calibrated.
|
 |
|
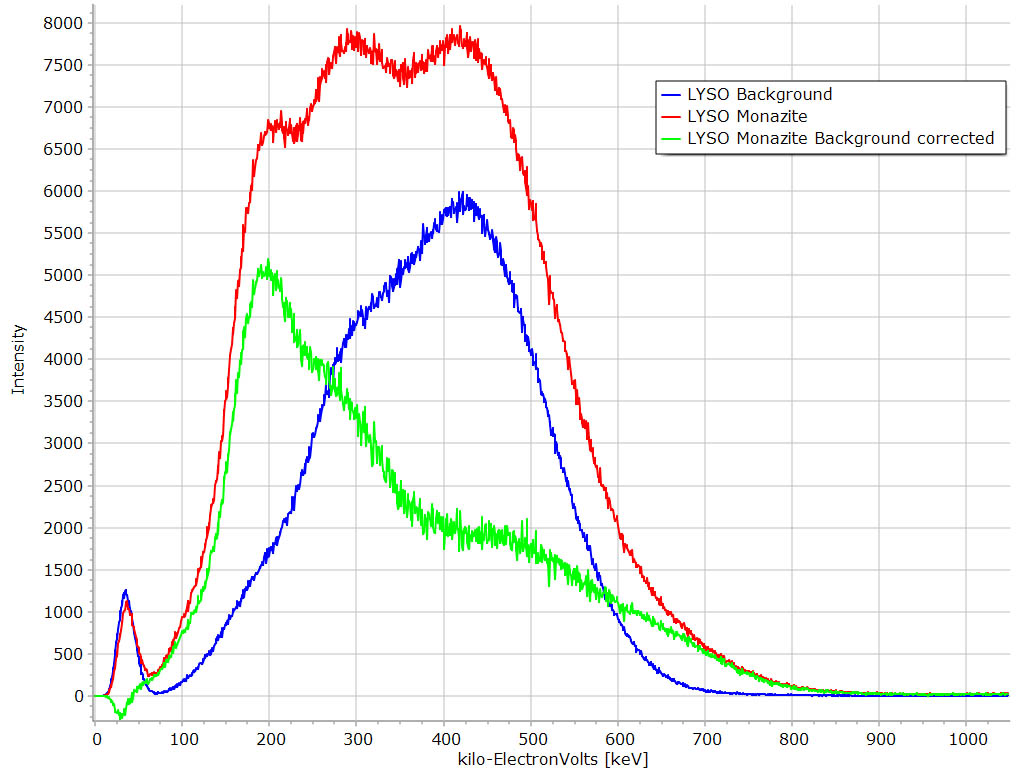
LYSO spectra. Note the high background (blue curve). Again this spectrum has very low resolution. |