Wollastonite Section Fluorescence
 |
|
|
Fluorescence of a wollastonite section. Transmission view. The blue fluorescence is coming from the glue to fix the minerals on the glass plate.
|
|
 |
|
|
Plane polarized view of the same section.
|
|
|
|
|
|
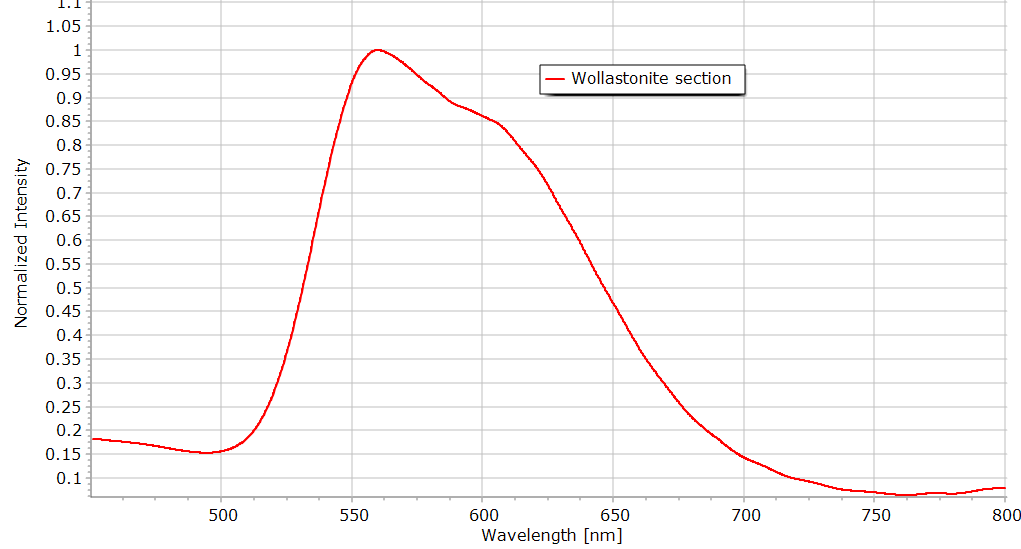
Wollastonite section yellow fluorescence reflection spectrum.
|
|
 |
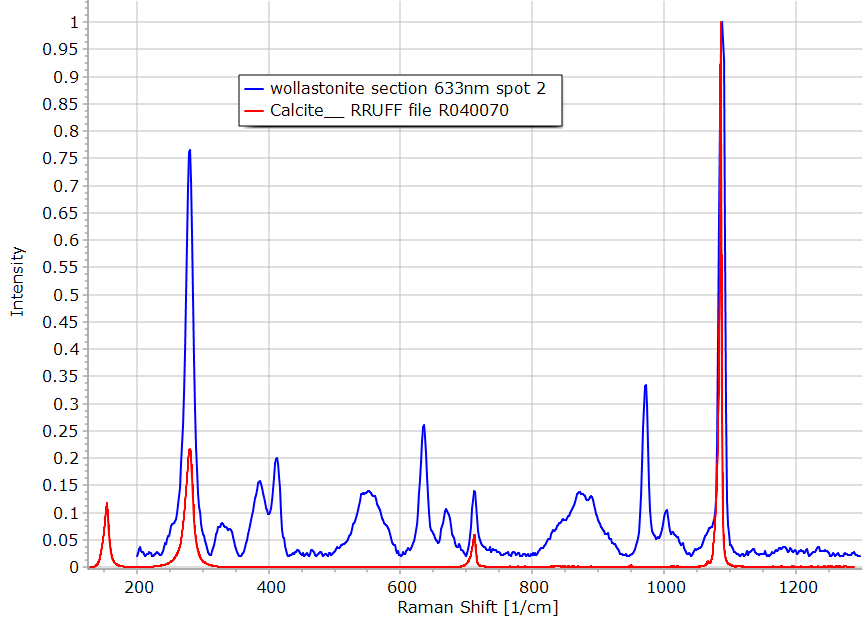
Raman spectra of the Wollastonite section.
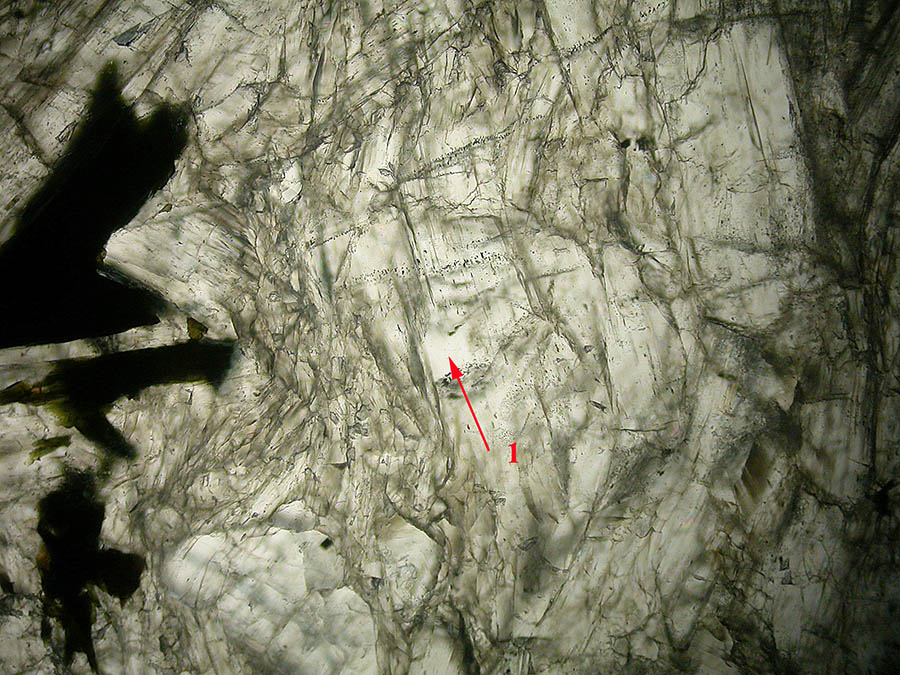
This section is about 250 mm thick co no crossed polars view are presented. Spot 1 represents the major component of this section. Raman has identified the wollastonite. |
|
|
This section is highly fluorescent so the Raman study is difficult. On the transparent crystals, the 532 nm laser gives only fluorescence and thus cannot be used. The situation is a little bit better with the red laser but each raw Raman spectrum comes on top of a big fluorescence intensity. On the left figure, I have used 2 microscope objectives, the 50X and 100X. The highest power objective gives a slightly better signal to noise ratio. |
|
|
The spectra of this thick section are not always coming from a pure mineral as illustrated on the left figure: here some calcite is also present in the wollastonite spectrum. |
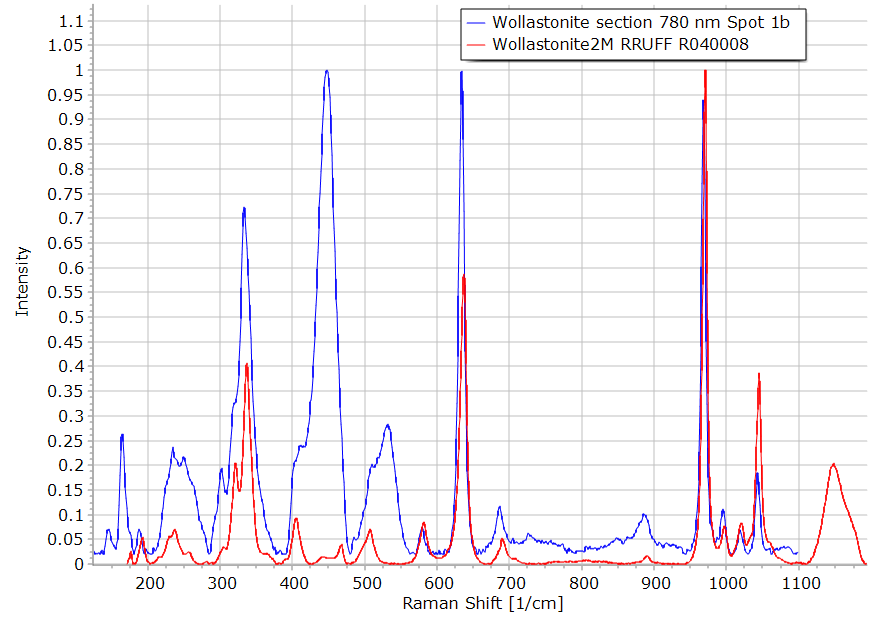 |
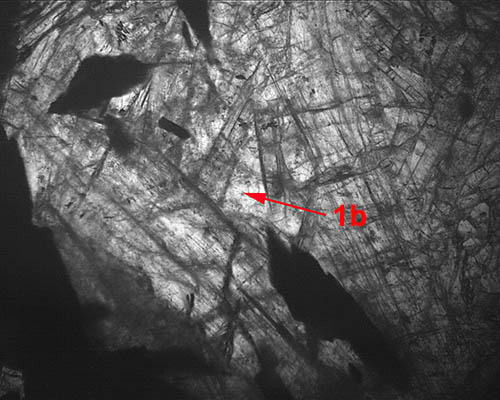
Because fluorescence is so high, I have tried the 780 nm laser to record some spectra. On the left a spectrum of location 1b. The spectrum has many common parts similar to a wollastonite reference spectrum from the RRUFF database but some additional peaks are present. No explanation is known up to now. |
|
|
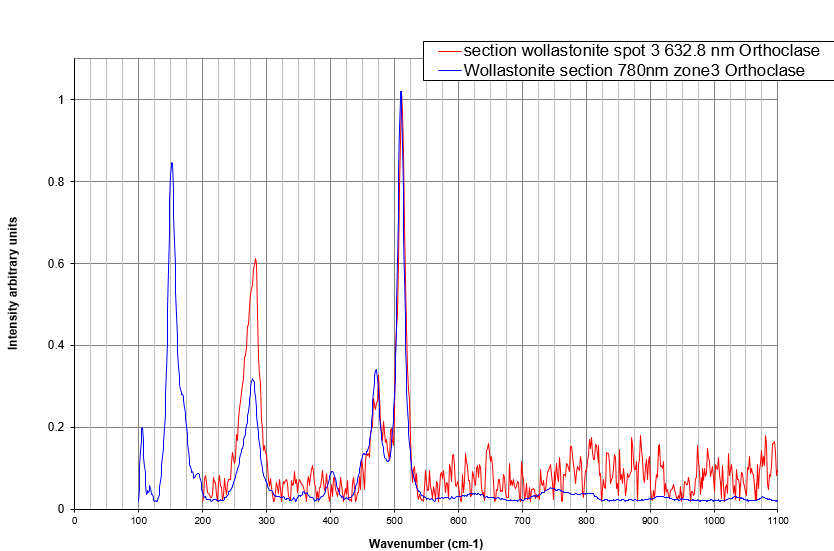
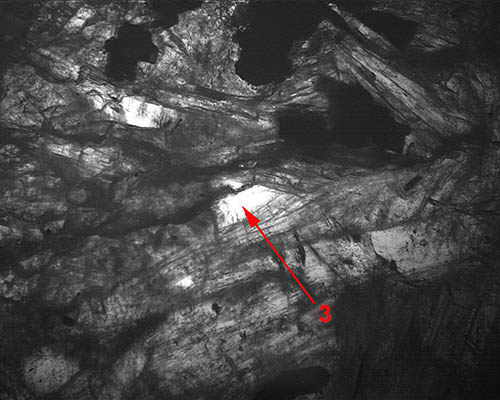 The brighter crystal Nr 3 on the image above is a feldspar orthoclase. The 780 nm Raman spectrum has a much better signal to noise ratio because fluorescence is absent at higher wavelength. |
|
|
The black crystals of this section are fluorescence free, they can thus be investigated with both 532 nm and helium neon laser. The database search gives Julgoldite as output as illustrated on the left but the mineral could also be Aegirine. |
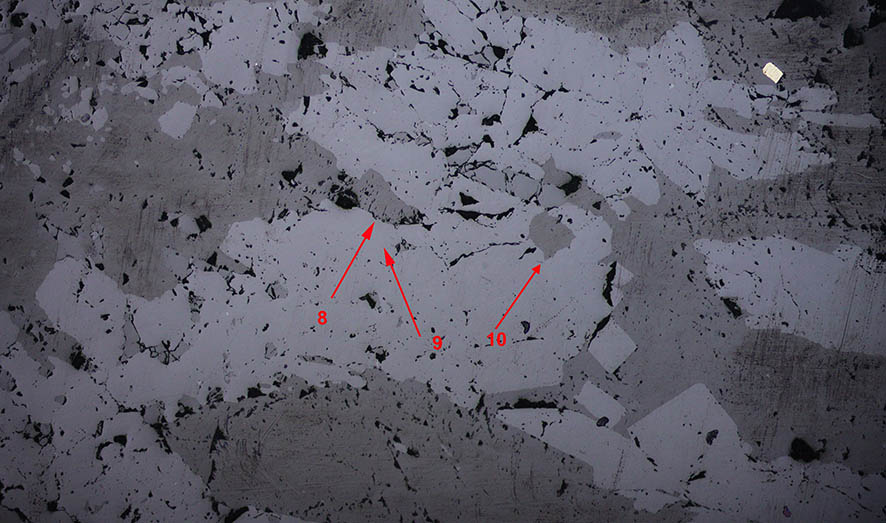 |
The green laser has also be used to study this dark mineral. The 3 spectra locations are shown on the reflection figure on the left. |
 |
Reflection image with crossed polarizers. |
|
|
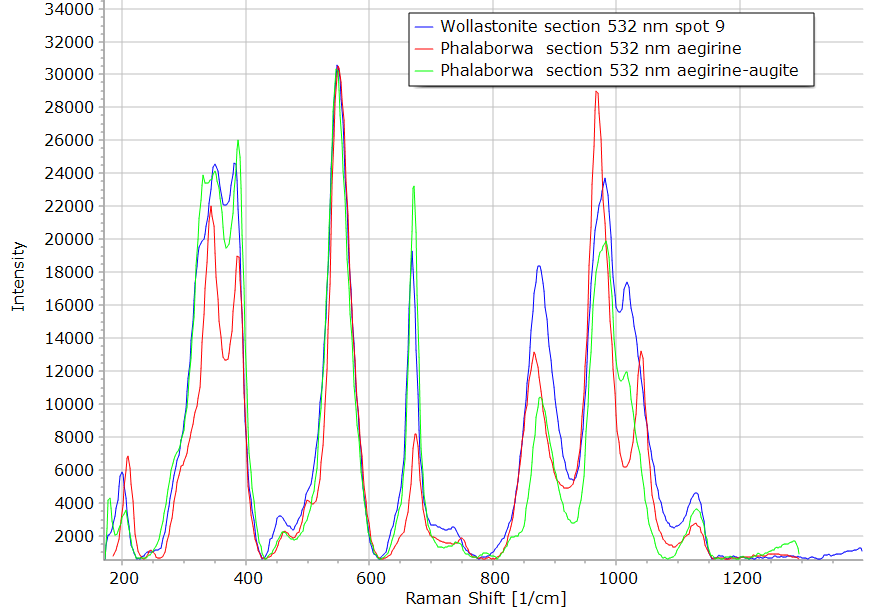
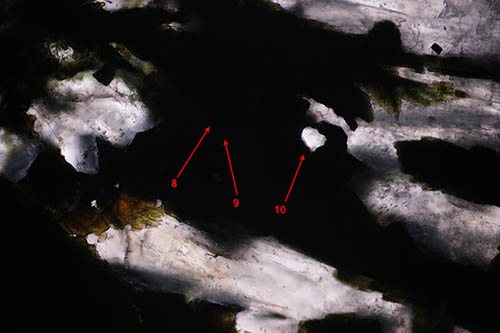 The transmission view does not give any details in this very dark mineral. The figure on the left allow us to compare the spectra of the dark region above with the aegirine spectra obtained on a section from Phalaborwa. Notice the high similarity with the Aegirine-augite minerals. |
|
|
The spectrum 8 has a additional narrow peak close to 1300 cm-1 compared to the other 2 spectra. This peak position corresponds to the mineral diamond but nothing in the microscopic images indicates the presence of such a mineral. No further attempt has been made to investigate this observation. |
