Conoscopy of Uniaxial Minerals.(5).
Section parallel to the optic axis.
Figure 1 illustrates the optical geometry for the formation of the conoscopic image if the crystal plate is cut parallel to the optic axis. The example shows the behavior of a positive crystal. The conoscopic figure plane must be rotated by 90° along CD axis for a true three dimensional representation. Polarizer direction is AB, analyzer direction is CD.
Isochromes. The cyclic section of the indicatrix is perpendicular to the image plane with its trace along AB so the ordinary index w is always parallel to direction AB of the interference figure. All the indicatrix sections containing principal extraordinary index e have their projections in the figure along axis AB so, along AB, the birefringence is constant and equal to the birefringence of the material examined but the retardation increases from center O to periphery A or B because the distance traveled by the light in the crystal increases as a function of the incidence angle. Along the other axis CD, the birefringence is no more constant and now decreases from the center O (its maximum value) towards C and D. In the figure, the extraordinary indices of these sections are notated e' and e". What about the retardation value which is the product of the birefringence (decreasing along OC and OD) and the light path (increasing along OC and OD)? The answer can be provided by a quantitative calculation. We can nevertheless depict the behavior qualitatively: first, what is the retardation value at infinity for a light direction parallel to the optic axis? At infinite distance in OC or OD directions, the e" index decreases to reach the w value. The birefringence is thus zero at infinite distance. A material with no birefringence is isotropic and exhibits no retardation whatever its thickness. As the retardation variation function must be continuous, we can conclude that the retardation decreases from the center O towards periphery C or D. Thus, increasing interference colors indicate the direction of the ordinary index w , and decreasing colors indicate the direction of the optic axis e.
What happens now off axis? Every section in the indicatrix with a pole in the interference figure close to the axes AB or CD has an extraordinary index lower then the one observed on the axis. In figure 1 we have represented some examples like e'², e'³ and e² with e'>e'² >e'³ .As we move further from one axis along the other axis direction, the birefringence decreases with minimum values on the 45° direction lines. In the quadrant D, to observe the same retardation off axis and on axis, we must move the off axis points (for instance at e'²) away from center to increase the light path and thus keep the same retardation value. This simple consideration explains that the isochromes of the conoscopic figure move away from center for positions more and more off axis. It can be shown mathematically that the retardation is constant along the two bisectrices of the axes with a value equal to the retardation at the center of the figure. The isochromes are thus equilateral hyperboles.
Isogyres. When the optic axis is colinear with the polarizer or analyzer directions, the field of view becomes almost completely dark as suggested by the parallelism of all indices of figure 1. When the stage is slightly rotated, all the indices are no more parallel to polarizer and analyzer so the light reappears and allows the isochromes figure to be seen. During rotation, the isogyres remain longer in the quadrants with lower birefringence and thus leave the field in the direction of the optic axis. Figure 1 is in fact in the position of the dark isogyre which has been here canceled with a Benford plate.
|
Figure 1. Conoscopy of a section parallel to the optic axis. Projection of the refraction indices in the conoscopic figure. |
For an illustration of the conoscopy of uniaxial minerals cut parallel to the optic axis, I have chosen the microscope quartz wedge as sample. It gives very good images as shown in figure 3 but it must be realized that the quartz wedge is not a single plate cut parallel to the optic axis but is in fact the addition of two plates: one with thickness increasing along w and a second of constant thickness rotated by 90° so large index of the wedge is parallel to the small index of the additional plate to give a subtraction of the retardations of both plates. This can be seen on figure 2 which is a normal picture of the quartz wedge between crossed polars : from left to right, the retardation is first decreasing to zero (dark band) then it increases to high orders. In fact, on the left side, the thickness of the wedge is lower than the thickness of the additional plate and the subtraction gives a negative value but only the absolute value of retardations can be seen as interference color. When thickness of the two plates are equal, the overall retardation is zero and the interference color is black.
|
|
Figure 2. Orthoscopic image of a quartz wedge. The dark
line (order zero) indicates that the quartz wedge is the addition of 2
plates with large indices perpendicular to each other so their
retardations subtract.
|
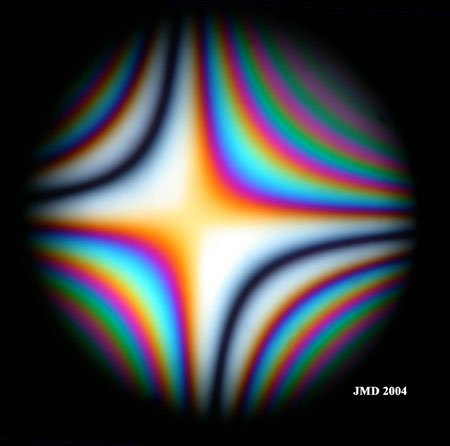
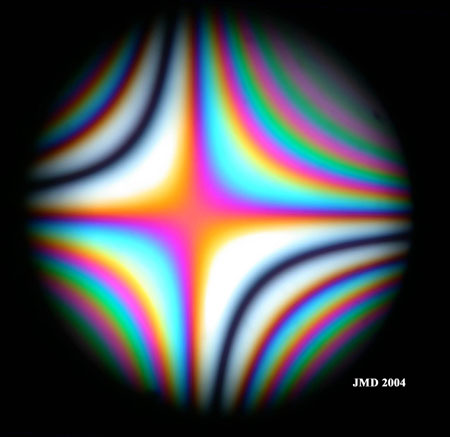
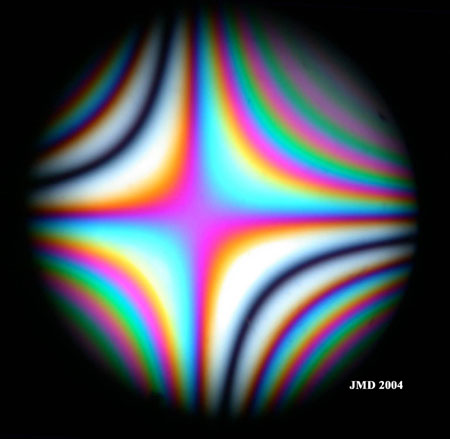
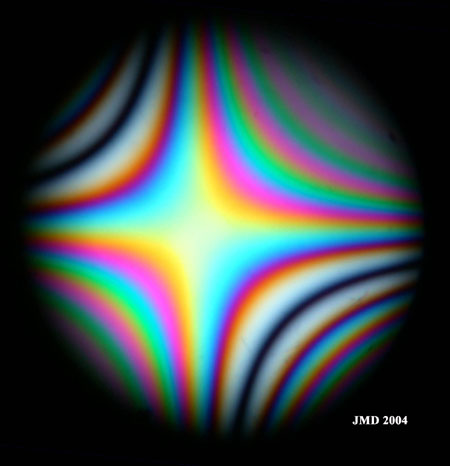
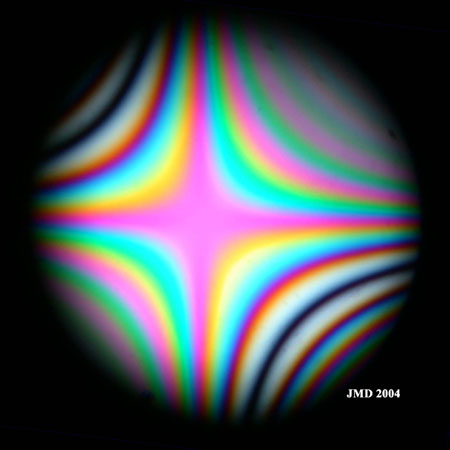
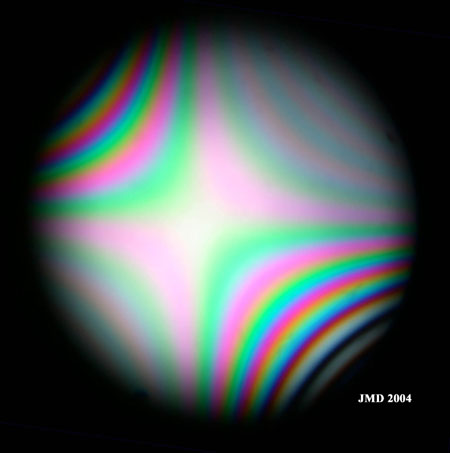
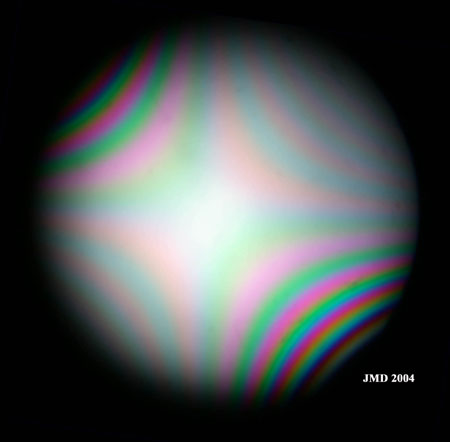
Figure 3 collects conoscopic images of the quartz wedge as a function of thickness. The images are oriented at 45° from polarizer to avoid the presence of dark isogyres not photographed because this gives only a dark image. The influence of the subtraction of the two plates also appears in conoscopy. The effect is the appearance of a zero order (black) hyperbole in the quadrants with decreasing retardations. This happens when the retardations of both plates are equal. The net effect is an increase of retardation in NE-SW quadrants and a retardation decrease in NW-SE quadrants. Direction of optic axis is NW-SE. The orders of the interference colors increase with thickness as expected.
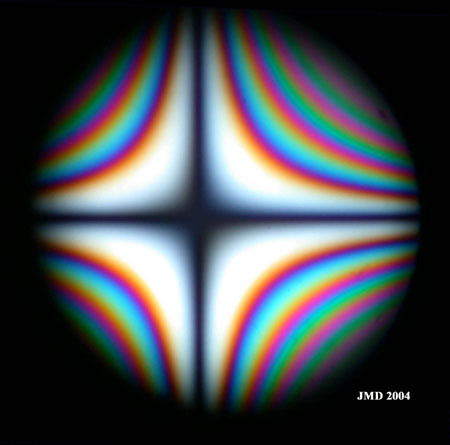
The addition of a quarter wave plate to the quartz wedge (figure 4) in a position of subtraction of their retardations gives the unusual interference figure with hyperboles and a dark cross at center which has of course nothing to do with isogyres.
|
Figure 3 a. Conoscopic image of the quartz wedge. Orientation of the plate at 45° from polarizer directions. Order 1 at the center. Thickness 1. |
Figure 3 b. Conoscopic image of the quartz wedge. Order 1 at the center. Thickness 2. |
|
Figure 3c. Order 2 at the center. Thickness 3. |
Figure 3d. Order 2 at the center. Thickness 4 |
|
Figure 3e. Order 3 at the center. Thickness 5. |
Figure 3f. Order 3 at the center. Thickness 6 |
|
Figure 3g. Order 4 at the center. Thickness 7 |
Figure 3h. Order 5 at the center. Thickness 8 |
|
|
Figure 4. Addition of a quarter wave plate to the quartz wedge with large indices perpendicular. Both retardations subtract. It is possible to find a thickness so that retardation at the center and along directions at 45° of the crystal indices is equal to 0. |


