Conoscopy of Uniaxial Minerals.(3).
Use of accessory plates
1. Wave plate
Accessory plates are crystal sections cut so that their retardation takes known and reproducible values. The most used are the wave plate and the quarter wave plate. The wave plate has a birefringence equal to a determined wavelength in the visible spectrum, generally 530 nm. If such a wave plate is examined under a parallel beam of light, there is an extinction at a wavelength of 530 nm. Thus, this green part of the spectrum is removed from white light to give a magenta color. The accessory plates are introduced in the microscope tube in a dedicated slot with their refraction indices at 45° from polarizer directions.
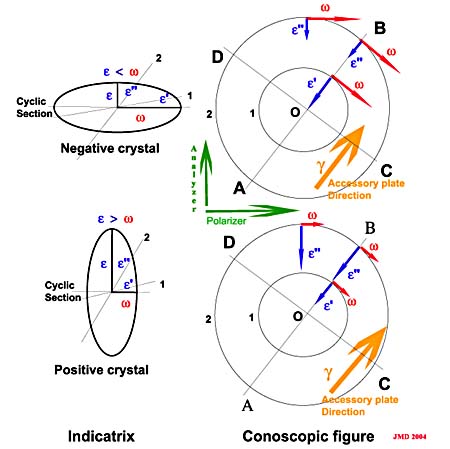
Optical sign of crystals: it is useful to briefly introduced the notion of optical sign. The indicatrix of uniaxial crystals is an ellipsoid with a circular symmetry. According to the relative values of the principal axes of this ellipsoid, the crystal is said to be positive or negative. Refer to figure 1 to see the differences. If the extraordinary index is greater than ordinary index, the crystal is positive. Figure 1 also illustrates the directions of refraction indices in the conoscopic figure. The greater index of accessory plate g is also represented.
What is the result of the introduction of a wave plate in the microscope tube? Let us summarize the results under parallel beam of light:
- If the examined crystal section has its indices directions parallel to polarizer directions, the effect is the same as if no crystal was present on the microscope stage. For the wave plate, the field has a uniform magenta color.
- If the examined crystal has indices directions at 45 ° from polarizer directions, the effect is an addition or a subtraction of the birefringences of crystal section and accessory plate. There is an addition of birefringences if great indices of both plates are parallel and subtraction if small index of crystal is parallel to great index of wave plate.
- For any other direction, the situation is more complicated and should be computed but for our explanation of conoscopic figures, it is sufficient to notice that we have a continuous variation from the extinction values between 45° an 0°.
|
Figure 1. Optical sign of crystals |
The top part of this figure is a representation of a
negative optical sign. The radial index in conoscopic figure varies from w
at the center O to e
at infinity. The birefringence is zero at the center and increases from
center to periphery of the figure. Small index of crystal is parallel to
great index of accessory plate.
For a positive crystal, the radial index in the conoscopic figure is minimum at the center (w) and increases towards periphery. The birefringence is also zero at center and increases when moving to periphery. Both great indices of crystal and accessory plate are parallel. |
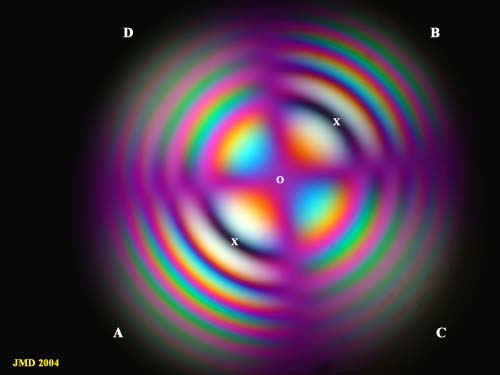
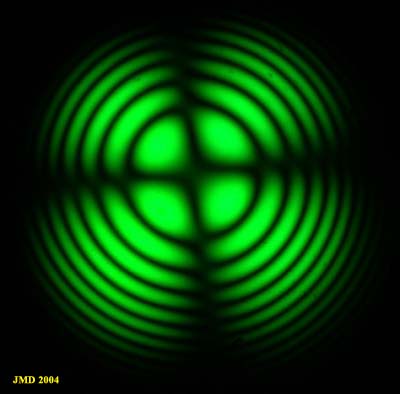
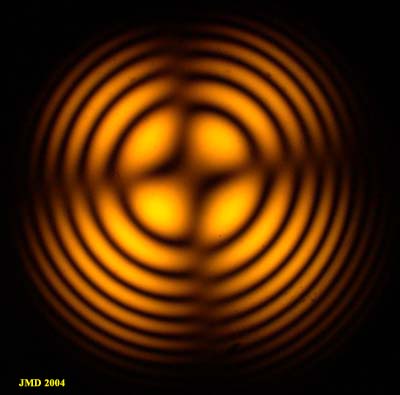
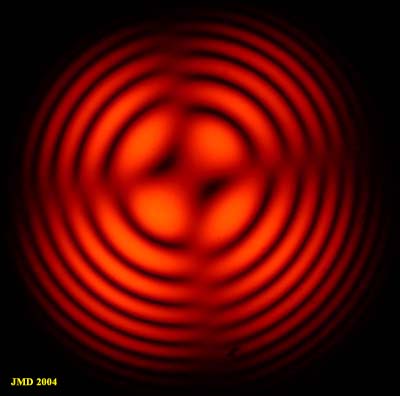
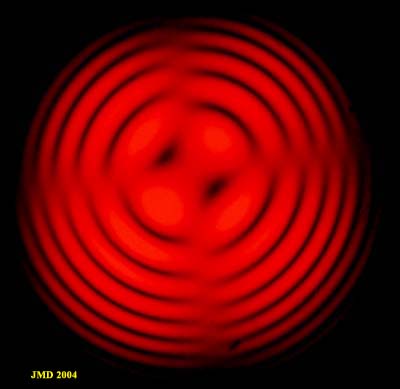
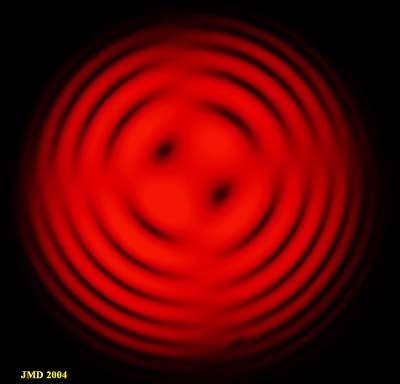
Let us examine now the modification of the uniaxial conoscopic figure perpendicular to the optic axis if a wave plate is introduced in the microscope tube. The figures 2 and 3 show this modification for a calcite section. The wavelength dependence is illustrated in figures 4 to 11 below. Calcite is a negative crystal so the following discussion will refer to the upper part of figure 1 for the refraction indices orientations.
For the interpretation of a conoscopic figure with addition addition of a wave plate, we can restrict the discussion to directions parallel to polarizer and analyzer and directions at 45°. In the conoscopic figure, the small indices of the calcite sections ( e' and e'') are always oriented radially. Along direction AB in figure 1 and 3, the small indices of calcite are parallel to great index of wave plate so, referring to preceding discussion, the birefringence of calcite and wave plate must be subtracted. Of course the result cannot be negative so we consider the absolute value of this subtraction. As the retardation of the calcite section increases along AB from 0 at the center of the figure to a large value ( close to e) at the periphery of the interference figure (thickness of section and birefringence increase with beam angle) there should be 2 points where retardation of calcite and retardation of wave plate are equals. These two points must be dark for all wavelengths, they are marked as X on figure 3. If the birefringence of the examined crystal is lower, these dark points are moving away from center. Along diagonal AB, the retardation decreases while it increases along diagonal CD because for the CD direction, w the great index of crystal section is parallel to great index of wave plate so birefringences must be added. Along AB, the first order ring of figure 2 becomes a "zero order" ring (black) with addition of the wave plate , the second ring being a first order one. Along CD, the first ring is already second order.
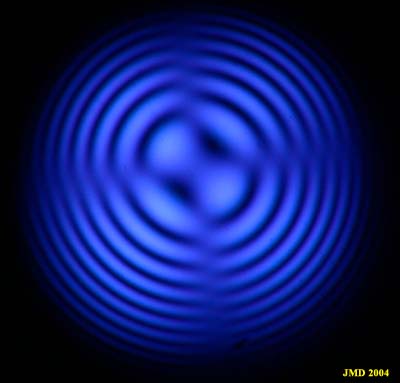
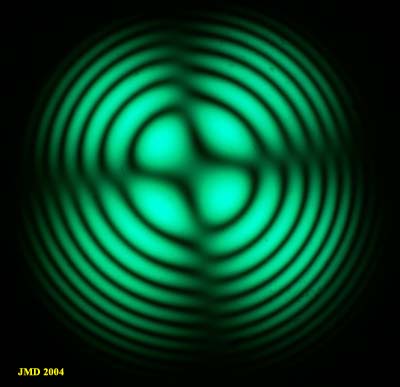
To explain what happens with the isogyres and the colors appearing in the vicinity of the center, it is best to consider the figures as a function of wavelength (figures 4 to 11). From the results for parallel light we know that if crystal indices are parallel to polarizer directions the extinctions are those of the wave plate alone. The wave plate in such a situation has extinction at 530 nm so at this wavelength the points along polarizer axes should form a dark isogyre. The conoscopic figure at 520 nm (figure 7) shows rather good isogyres. This is no more true for other wavelengths: the figures for wavelengths far away from 530 nm, for instance 420, 628 and 680 nm, exhibit no dark isogyres at all. So the net result is a dark cross at wavelengths close to 530 nm which produces a pink (minus green) isogyre in white light.
At the center of the conoscopic figure with wave plate inserted, the retardation equal that of wave plate alone, let us call it R1. If we move from center to point X along diagonal AB, the retardation decreases from R1 to zero. At the center, R1 equal to 530 nm. So from center to point X, the retardation will be equal to wavelengths going down regularly and thus giving extinctions from green to violet light. Look at the sequence figures 7, 6, 5 and 4. In white light along AB, yellow spots are produced close to the center. Along the other diagonal CD, the retardations are added so moving off center will produce an extinction for wavelengths greater than 530 nm. The sequence of figures 7,8,9,10,11 depicts this situation. In white light, blue spots appear along diagonal CD.
For a positive crystal, the diagonals of the figure should be reversed.
|
Figure 2. Calcite perpendicular to optic axis (white light)
|
Figure 3. Same crystal with addition of a wave plate
|
|
Figure 4. 420 nm |
Figure 5. 468 nm |
|
Figure 6. 505 nm |
Figure 7. 520 nm |
|
Figure 8. 578 nm |
Figure 9. 600 nm |
|
Figure 10. 628 nm |
Figure 11. 680 nm |
