Index of Refraction measurement.
-
Dispersion curves.
-
Oblique illumination method.
-
Phase contrast method
-
Becke line method.
-
Bibliography.
The measurement of the indices of refraction of small particles is well described in the literature [see for example 1 and 2]. The purpose of this page is to give some short explanation of the colored effects observed with different microscopic techniques and to insist on the possibilities and ease of use of the phase contrast microscopy although this method is much less cited in the literature in the field of mineralogy [see for example 3].
The variation of the index of refraction versus wavelength (dispersion curve) is illustrated on the graph below. We have taken the hypothetical example of a liquid and two solids with refraction indices close to each other. As the dispersion is generally greater for liquids than for solids, with a good choice of the immersion liquid the curves of solid and liquid may cross each other. [ref. 1 and 2].
Figure 1.
3. Oblique illumination method.
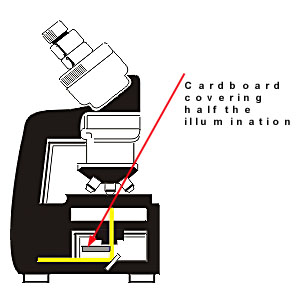
Figure 2.
In the oblique illumination method, the normal illumination system of the microscope is used except that a piece of cardboard is placed beneath the condenser system to block half of the light and thus to create a half illuminated field. If we place a crystal at the border between the bright and dark part of the field, this crystal is only illuminated on one half. The side of the crystal which appears clear depends on the relative value of the refraction indices of the immersion liquid and the crystal. If ncrystal is grater than nliquid than the bright side of the crystal is oriented towards the bright side of the field. The reverse is true if ncrystal is lower than nliquid. [ref. 1 and 2]. The method is easy to use and can be recommended to determine the which of the crystal and the liquid has the highest index when the two indices are rather far from each other.
If the crystal and the liquid have close indices with dispersion curves crossing each other (see graph above), than the crystal illumination is directed to the bright half of the field for wavelengths higher than the crossing point and inversely directed towards the dark half for wavelengths shorter than the crossing point. As the light of a part of the spectrum is going to one direction and light from the other part of the spectrum in the other direction, the result is a crystal with colors appearing on each side. The real colors depend on the position of the crossing point [ref.1 and 2]. The most intense colors are obtained when this crossing point is located in the yellow part of the visible spectrum around 580nm : the crystal is blue on one side and orange-red on the other side.
The optical arrangement for polychromatic and monochromatic phase contrast experiment with small particles is illustrated below.
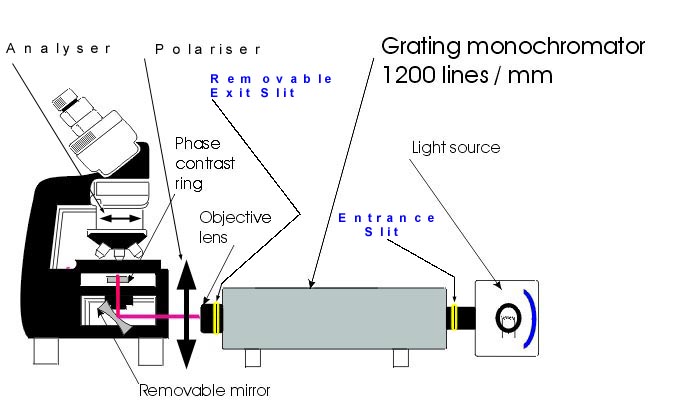
Figure 3.
The phase contrast microscopy is extensively used in biology to enhance the image contrast of living organisms in a liquid medium when the difference of the indices of refraction between the object and the immersion liquid is small. The object (in our case a mineral particle) may appear lighter or darker than the surrounding liquid according to the index difference between liquid and solid [Ref. 4]. In phase contrast microscopy, the object is surrounded by a halo with brightness opposite to the object brightness (bright crystal with a dark halo or dark crystal with a bright halo). If the indices of liquid and solid are close to each other with dispersion curves crossing like in the situation described in figure 1, the halo below the crossing point (low wavelengths) appears darker while it appears brighter for the higher wavelengths. Finally, halo is bright for wavelengths higher than the crossing point of the dispersion curves and crystal is bright for wavelengths below that point which gives for a match point at 580nm a red halo and a blue particle [Ref. 3]. In fact depending on the phase equipment used, the reverse situation can also be true (negative phase contrast) giving complementary colors for crystal and halo.
In the figure above, the phase contrast microscope is equipped with a monochromator illumination to determine with precision the match point between liquid and crystal. When the wavelength of the match point has been measured and the dispersion of the liquid has been determined with a refractometer, the index of refraction of the solid can be calculated for the standard wavelength (D line of sodium). The method I am using for this calculation is a method developed by Su [Ref. 2].
To increase the range of indices measurable with one liquid, high dispersion liquids can be chosen. To cover the range from 1.42 to 1.72 I am using: tributylphosphate, ethylphtalate, ethyl cinnamate, 1-bromonaphtalene, 1-iodonaphtalene and di-iodomethane.
For the practical determination of indices, the first step is to find a liquid with an index of refraction close to the index of the solid with the oblique illumination technique with trial and error. When a match has been approximately found I am using the phase contrast method in polychromatic and monochromatic light to determine the wavelength of the match point. The phase contrast method is much easier to use and is also more sensitive than other methods when the indices of liquid and solid are close. The method can also be used with very small particles (~5 µ).
The Becke line method is a well known method extensively described in the literature [for instance in ref. 2]. When the stage of the microscope is lowered, a faint line is moving into the crystal if its index of refraction is higher than the liquid, the reverse is true if the index of the crystal is lower than the index of the immersion liquid. If the dispersion curves are crossing like in figure 1, there are two lines moving in and out according to the wavelength of the light. In this situation, colored effects appeared. To determine the match point between dispersion curves, the phase contrast method is by far superior.
1. Essam E. El-Hinnawi, Methods in chemical and mineral Microscopy, Elsevier 1966.
2. R.E.Stroiber, S.A.Morse, Crystal Identification with the Polarising Microscope, Chapman & Hall, 1994.
3. K.G.Schmidt, G.Heidermanns, Zur Technik der Staubmikroscopie mit Phasenkontrast und Grenzdunkelfeld, Staub 18, 236, (1958).
4. J.H.Richardson, Handbook for the light microscope, Noyes Publication, 1991.